Best Practices for Deploying and Scaling Industrial AI
Artificial Intelligence (AI) is transforming industrial operations, helping organizations optimize workflows, reduce downtime, and enhance productivity. Different industry verticals leverage AI in unique ways.
Accelerating Manufacturing Digital Transformation with Industrial Connectivity and IoT
Digital transformation is empowering industrial organizations to deliver sustainable innovation, disruption-proof products and services, and continuous operational improvement.
Leading a transportation revolution in autonomous, electric, shared mobility and connectivity with the next generation of design and development tools.
As businesses become data-driven and rely more heavily on analytics to operate, getting high-quality, trusted data to the right data user at the right time is essential.
The goal of automated integration is to enable applications and systems that were built separately to easily share data and work together, resulting in new capabilities and efficiencies that cut costs, uncover insights, and much more.
Digital transformation requires continuous intelligence (CI). Today’s digital businesses are leveraging this new category of software which includes real-time analytics and insights from a single, cloud-native platform across multiple use cases to speed decision-making, and drive world-class customer experiences.
Data Storytelling as a Strategic Competency in Enterprise Decision-Making
Coding software developer work with AR new design dashboard computer icons of scrum agile development and code fork and versioning with responsive cybersecurity.StartUp Programming Team.
Analysts who embrace storytelling will not only elevate their craft but will also become indispensable partners in shaping the future of enterprise decision-making.
For years, analytics was treated primarily as a reporting function. Analysts were expected to gather requirements, extract data, and deliver metrics. Success was often measured by the ability to produce accurate dashboards on time.
Over the last decade, dashboards have become synonymous with enterprise analytics. Every major business unit now has access to performance dashboards, operational scorecards, and KPI trackers. While these tools have advanced in sophistication, they are not sufficient to drive transformative executive decisions.
Executives face a paradox: despite being surrounded by more data than ever before, many still struggle to translate dashboards into action. Static visuals show what is happening, but they rarely explain why it is happening or what to do next.
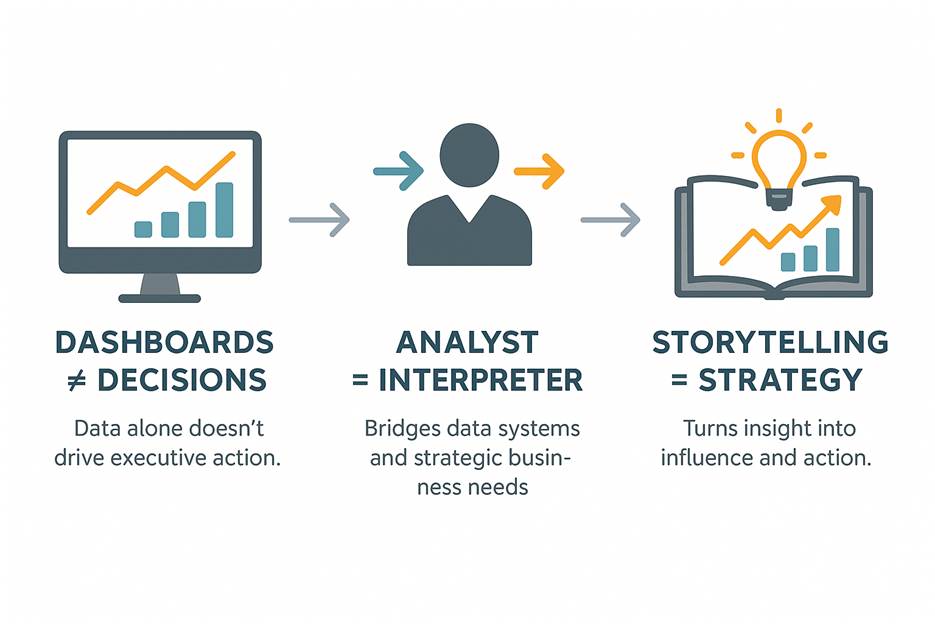
This is where dashboards reach their limit. They provide information, but information alone does not influence decision-making. What executives need is not just the “what,” but the “so what” — context, implications, and a clear call to action.
As data volumes continue to grow with the proliferation of cloud platforms and real-time streaming systems, the pressure to extract actionable meaning from dashboards is intensifying. Simply put: more dashboards do not equal better decisions.
Reframing the Role of Analytics
Analytics has traditionally been treated as a reporting function: produce dashboards, track KPIs, and deliver metrics on demand. But this framing is increasingly outdated.
Modern analysts serve as interpreters between technical systems and business stakeholders. They don’t just build reports; they shape the conversation around what the data means. This evolution repositions analytics as a strategic function—closer to decision-making than ever before.
This shift is being recognized across industries. Gartner predicts that by 2025, “storytelling with data” will be a core skill for 80% of data and analytics leaders. This signals an important trend: organizations are acknowledging that dashboards alone are not enough; interpretation and storytelling are becoming strategic requirements.
In practice, this means analysts are no longer just report builders. They are communicators, facilitators, and advisors. They bridge the gap between raw data and executive action.
Advertisement
Storytelling as a Strategic Competency
Storytelling has always been a powerful tool in human communication. In analytics, it is emerging as a strategic competency — a skill set that elevates data from static reporting to enterprise-wide action.
The distinction lies in how insights are framed. A churn rate of 8% is a statistic; a story that explains how onboarding friction is eroding customer loyalty — and what steps could resolve it — is a narrative that compels leaders to act. Numbers speak to logic; stories speak to both logic and emotion.
Executives, who are inundated with competing priorities, often remember the narrative more than the specific metric. A well-told data story helps leaders visualize scenarios, anticipate outcomes, and align decisions with strategy.
Crucially, storytelling in this context is not embellishment. It is about structuring and presenting data in a way that makes meaning clear, actionable, and memorable. That is why it should be understood not as a “soft skill” but as a strategic competency.
A Practitioner’s Framework for Data Storytelling
Translating data into action requires a structured approach. A practitioner-focused framework can be built on three pillars:
1) Audience Segmentation Insights must be tailored to their audience. An executive team needs a strategic lens — risk, opportunity, and competitive positioning. Operational teams need tactical guidance. The same dataset can generate different stories depending on who is listening.
2) Narrative Arc
Borrowing from classic storytelling, data presentations should have a beginning, middle, and end:
Context – What is the situation?
Tension – What challenge or risk does the data reveal?
Resolution – What decision or action should follow?
3) This arc creates a flow that guides the audience from facts to implications to outcomes.
4) Visualization as Illustration Charts, dashboards, and visuals should reinforce the story, not replace it. A well-chosen visual makes the narrative clearer; too many visuals risk diluting the message. Think of visuals as the illustrations in a book — important, but always in service of the story.
This framework applies across settings — from real-time machine-to-operator interactions in industrial contexts (where seconds of latency matter) to quarterly business reviews in boardrooms. What matters is not the format, but how quickly and effectively insights are transformed into decisions through narrative framing.
A dashboard may show that 70% of departments have migrated to cloud services. While useful, this metric becomes more powerful when framed as a transformation journey: which departments are leading adoption, which are lagging, and what competitive risks exist if the laggards do not catch up. The story turns adoption percentages into a narrative about digital competitiveness.
Customer Churn Analysis
Reporting that “customer churn increased by 8% last quarter” is informative but incomplete. A data story reframes this: “Customers are leaving not because of pricing, but because onboarding is confusing. Evidence shows drop-offs spike in the first 14 days. Addressing this could save $20 million annually.” Suddenly, churn is not just a number but a solvable business problem.
Executive Dashboards
Executives are presented with dozens of KPIs, but without context, these become noise. Data storytelling connects metrics to enterprise strategy. For instance, a dip in revenue is not just a number — it is a sign of a market shift, a product adoption challenge, or a customer satisfaction issue. The story clarifies what the data means and what actions should follow.
Organizations that embed storytelling into analytics delivery report faster decision cycles and higher adoption of insights. One global cloud provider, for example, found that reframing utilization metrics as narratives about customer success enabled executives to prioritize investments more effectively than dashboards alone.
Advertisement
Takeaways for Analysts
The evolution of analytics from reporting to storytelling marks an important shift in enterprise decision-making.
Dashboards alone don’t influence decisions. Without context, they risk becoming background noise.
Analysts are interpreters. They must translate data into business language that resonates with stakeholders.
Storytelling is a competency, not an accessory. By weaving narrative, visualization, and audience segmentation together, analysts accelerate decision-making and elevate analytics to strategy.
In today’s environment — where data flows in real time, cloud platforms generate constant insights, and executives face increasing complexity — the ability to tell compelling data stories is not optional. It is a strategic competency that defines the impact of analytics.
Closing Thought on Storytelling
Analytics is no longer about producing the most sophisticated dashboard. It is about delivering the story behind the numbers — a story that informs, persuades, and drives action. Analysts who embrace storytelling will not only elevate their craft but will also become indispensable partners in shaping the future of enterprise decision-making.
Nirmayee (Nemo) Dighe is the Associate Director of Business Intelligence at Group 1001, where she leads data and analytics strategy to drive smarter, faster, and more connected business decisions. With expertise in data strategy, AI adoption, and cross-functional collaboration, Nemo helps organizations translate technical innovation into measurable business value. Her work focuses on making AI practical, sustainable, and aligned with real-world impact—bridging the gap between data teams and decision-makers. Passionate about empowering others through data literacy and transparency, she brings a pragmatic, people-centered approach to digital transformation.
NVIDIA launched NVIDIA Nemotron 3 Super, a 120 billion parameter open model with 12 billion active parameters designed to run complex agentic AI systems at scale.
The expansion of smart cities and industrial deployments means infrastructure must be built to withstand harsh, evolving environments while maintaining reliable connectivity and power.
Time synchronization rarely gets much attention in cybersecurity, but it should. It underpins the security functions that teams rely on every day, from trustworthy logs and threat detection to forensic review and compliance reporting. In Zero Trust environments, trusted time helps keep those systems aligned and plays a growing role in resilience and compliance. A […]
AI-powered NaaS represents a foundational shift toward self-managed, adaptive infrastructure built to support the data-intensive demands of modern organizations.
Accepting that AI is being designed for machines rather than humans forces a shift in responsibility. The burden moves away from making systems intuitively understandable and toward making them structurally accountable.
Analysis and market insights on real-time analytics including Big Data, the IoT, and cognitive computing. Business use cases and technologies are discussed.
Advertiser Disclosure: Some of the products that appear on
this site are from companies from which TechnologyAdvice
receives compensation. This compensation may impact how and
where products appear on this site including, for example,
the order in which they appear. TechnologyAdvice does not
include all companies or all types of products available in
the marketplace.

 Best Practices for Deploying and Scaling Industrial AIArtificial Intelligence (AI) is transforming industrial operations, helping organizations optimize workflows, reduce downtime, and enhance productivity. Different industry verticals leverage AI in unique ways.Link to The Center for Adaptive Edge Intelligence
 The Center for Adaptive Edge IntelligenceAdaptive edge intelligence brings real-time decision-making to the point of data creation, whether from sensors, machines, or cameras.Link to The Value of Vehicle Electrification
 The Value of Vehicle ElectrificationElectric vehicles (EVs) present automakers with many design, engineering, and manufactu ring challenges.Link to Accelerating Manufacturing Digital Transformation with Industrial Connectivity and IoT
 Accelerating Manufacturing Digital Transformation with Industrial Connectivity and IoTDigital transformation is empowering industrial organizations to deliver sustainable innovation, disruption-proof products and services, and continuous operational improvement.Link to Smart Manufacturing for Automotive
 Smart Manufacturing for AutomotiveLeading a transportation revolution in autonomous, electric, shared mobility and connectivity with the next generation of design and development tools.Link to Center for Data Pipeline Automation
 Center for Data Pipeline AutomationAs businesses become data-driven and rely more heavily on analytics to operate, getting high-quality, trusted data to the right data user at the right time is essential.Link to Center for Automated Integration
 Center for Automated IntegrationThe goal of automated integration is to enable applications and systems that were built separately to easily share data and work together, resulting in new capabilities and efficiencies that cut costs, uncover insights, and much more.Link to Continuous Intelligence: Insights
 Continuous Intelligence: InsightsDigital transformation requires continuous intelligence (CI). Today’s digital businesses are leveraging this new category of software which includes real-time analytics and insights from a single, cloud-native platform across multiple use cases to speed decision-making, and drive world-class customer experiences.