


Unified monitoring is a valuable approach for making sense of the diverse and modular nature of modern DevOps and IT system design. But data unification is only a first step. This caveat is because systems have become increasingly complex in four distinct ways.
- They are more modular.
- They are more distributed.
- They are more dynamic.
- They are more ephemeral.
The combined complexity of these factors presents a major challenge to traditional monitoring technology. And this is precisely where AI-driven observability shines in helping unified monitoring to achieve its full potential.
![Featured Resource: Observability with AIOps For Dummies [Download Now]](https://no-cache.hubspot.com/cta/default/8019034/d0413c26-95d1-4dc7-a112-192c3e372de0.png)
Complexity and the breakdown of traditional monitoring approaches
These four dimensions of complexity mean that DevOps and IT systems have an ever-growing number of differentiated, autonomous components. Historically, monitoring technology has specialized according to the nature of components or objects being monitored. As networks, servers, storage, and applications were bought and implemented independent of one another, the monitoring technologies fragmented into tools for network monitoring, infrastructure monitoring, storage monitoring, and eventually application monitoring.
The rationale behind this specialization was two-fold. First, each of the component types generated distinctive data types within distinctive contexts. It made sense to optimize data ingestion for the environment from which data was being gathered. Second, the components themselves interacted with one another infrequently and in highly predictable ways. There was little need to integrate observations from one component with observations from another component to see how one’s DevOps or IT system operated from end to end. But in truth, most performance problems of a particular component were caused by rogue state changes occurring within that component alone. Root cause analysis rarely required looking anywhere else.
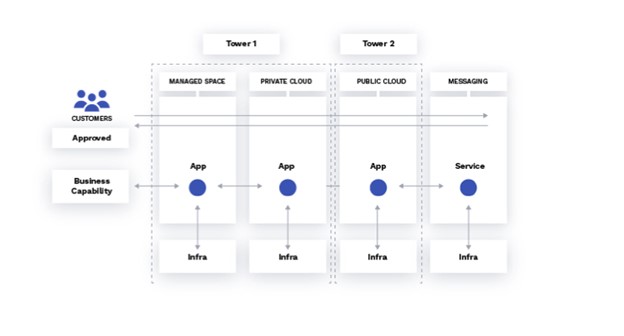
Fast-forwarding to the hyper-scale and complexity of IT systems today, we find modern IT infrastructure has undermined the original rationale for specialization. The number of disparate components has grown too large to support component-specific monitoring. Not only have architectural layers multiplied but also the function and behavior of components within each architectural layer are now radically distinct from one another (see figure above).
In practical terms, knowledge of how one component behaves cannot be applied to another. The rules for interpreting the self-described data generated by one component cannot be assumed for another. Historically, the use of a handful of monitoring tools ingesting data from a single stack may have been merely an awkward inconvenience. In a modern enterprise, 10, 20, even 50 different monitoring tools have become impossible to use with traditional workflows.
Moreover, because of multiplication and differentiation, the interactions of different components have become much more complex, and the interdependencies of components have deepened. This means that the root cause of a performance problem in one component frequently stems from a state change of one or more other components. A specialized, component-specific monitoring environment would yield only local information. This data would not provide IT Operations, site reliability engineering, or DevOps teams with enough insight to diagnose the root causes of a modern problem — let alone predict its future occurrence.

Two varieties of unified monitoring fall short
With the rationale for specialization now outmoded, the desire for a unified approach to monitoring has shifted from nice-to-have to a must-have requirement. Some vendors have accommodated this shift in two ways – and both bring compromising issues.
One approach entails visualization systems that gather data from a broad array of components and present them together within a single frame. This visual frame is typically organized according to a graphical model with user-adjustable parameters. Note that the model is not intended to provide insight directly into what the data means. Its sole purpose is to organize the data gathered and make it easier for the user to survey it and generate their own insights. Visualization systems work in real time or near-real time. There is often a replay capability that allows the user to rerun the flow of data across the screen.
Other vendors have built polyglot data platforms capable of ingesting, storing, and providing access to a variety of data types. These can range from unstructured logs, metrics, and, more recently, traces. Generally, the strategy is to gather data from multiple sources and domains, and then to pour this data into a vast unified data lake. Users are then provided with query languages, visualization tools, and statistical analysis environments to help them navigate the lake. Unlike visualization systems, polyglot data platforms are based on the application of historical data. Proponents of this approach argue that the cost in terms of the time it takes for users to notice the data is more than compensated by the easy access to historical context.
Both approaches are fundamentally flawed. They do not address the consequences wrought by self-describing data and patterns of modern IT system behavior. Things like noise, redundancy, intricacy, and scale. Put another way, unified monitoring is a necessary step in the management of modern IT systems, but it is far from sufficient.
The missing ingredient for monitoring modern systems is intelligent observability.
Using observability to cope with noise and redundancy
Operations teams in modern environments now understand that the volume of data, velocity of change, and variety of data types characterize the monitoring data sets that a digital business needs to process for true unified monitoring.
In the case of IT and DevOps systems management, one must also add characteristics of noise and redundancy. This is a natural consequence of the system architectures supporting digital business being modular, distributed, volatile, and ephemeral. When a system component changes state, it typically must send a signal announcing its change of state to all connected components. Since that signal is essentially the same, no matter the component, most of these signals end up being redundant. A highly modular system means not only many more components but also many more component interconnections. The result is many more redundant messages that teams must deal with as part of their job.
From there, the situation with legacy tools gets even worse. Communication channels are almost always the main sources of data corruption. Since these redundant signals from interconnected components are traversing so many more channels, the probability of data corruption has skyrocketed. Even with unified monitoring, merely gathering all this data together in one place is unhelpful. Analysis is required to eliminate the noise and strip out the redundant data before teams can even start to determine whether an incident has occurred, its cause, and the possible consequences. Given monitoring volume, velocity, and variety, such analysis cannot be conducted efficiently and effectively by human beings without the assistance of modern, intelligent observability tools.
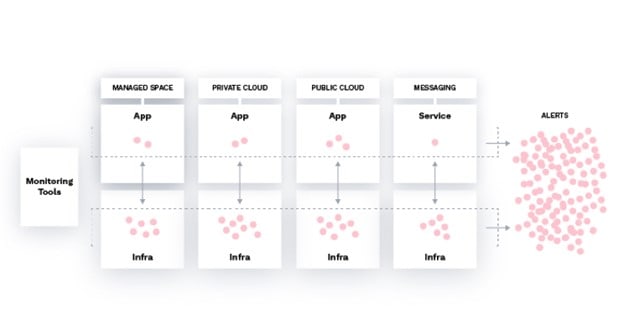
What specific role does observability play here? After data cleansing, the real work begins. Patterns must be discovered in the data that will provide insight into the behavior of the IT or application system (see figure above). With so many components acting in semi-independence from each other, the patterns that adequately describe system behavior are incredibly complex. To the human brain, even if assisted by powerful visualization tools, these patterns may look indistinguishable from random fluctuations.
Why not use statistical analysis tools to obtain insights? Because these tools typically ask the human analyst to choose from a library of comparatively simple probability distributions as a basis for understanding the data. Unfortunately, these distributions rarely match the distributions that are actually responsible for the data. In other words, even with cleansed data, teams need observability to discover the patterns that genuinely exist in the data, no matter what the complexity may be.
By utilizing an AI-based observability approach, teams can get a deeper understanding of the incident impacts and triggering events in real-time with a unified monitoring solution. In times of crisis, having this data helps to:
- Identify the necessary teams to remediate the problem quickly
- Identify the possible root cause
- Enable automated recovery
- Drive down measures of MTT(x)
The way forward is with intelligent observability
The bottom line is that unified monitoring is critical for taming the modular nature of modern system design. But data unification is only a first step. The next and crucial step is to set the power of AI-based data cleansing and pattern discovery loose on the vast data sets. Only then can an IT Operations, SRE, or DevOps team effectively support today’s digital business, with its reliance on hyper-complex infrastructure and application stacks.