

End-of-line inspection has become a standard part of any modern production line. Checkweighers, metal detectors, X-ray inspection systems, and vision systems all monitor production to ensure the quality and conformity of products. However, these devices typically make binary decisions – an item is either good or bad – with the data used to make the decision discarded immediately afterwards.
Traditionally, the data shared has been limited to information such as whether the unit is running correctly or if there are any signs of a fault. This ‘slow-moving’ data does not change often, and although it provides useful supervisory information, it does not allow for detailed analysis. However, the dramatic decrease in the costs associated with data collection, storage, and analysis – as well as tools such as machine learning – means ‘fast-moving’ data can now be captured and analyzed.
By capturing each measurement made by a checkweigher, for example, trends can be identified before a problem becomes a major issue. If four filling machines are involved in producing a product, and a fault means that one bagger consistently produces a product that is overweight, when analyzing the batch averages across the four machines, the high-level data does not suggest anything is out of range. However, if the individual weights are analyzed, a pattern emerges – allowing the issue to be identified and resolved.
Similarly, in the case of a chocolate enrober coating multiple lanes of chocolate bars, if the flow rate is non-uniform across the belt, then the chocolate layer on the central bars will be thicker than that on the outer bars. Identifying and rectifying this issue allows for the coating to be run closer to the optimal level – ensuring all bars meet the required weight. Without this insight, the enrober will be adjusted to ensure the outer bars meet the minimum weight, resulting in a ‘giveaway’ cost of the additional chocolate on the inner bars. Data at a batch level will not resolve this variation – but data on individual weights will.
Vision systems are often used to ensure labels are properly applied – something that is of particular importance if key allergen information is present. Additionally, information such as weight and price are checked, ensuring the information has been printed correctly and legibly. The linking of a weigh price labeler to a vision system is a simple example of the power of linking equipment. By analyzing the contrast of the print, a warning can be generated if the print head is failing. This allows for preventative maintenance to occur, rather than waiting until the print quality falls below an acceptable standard – at which point an unplanned stoppage will be required.
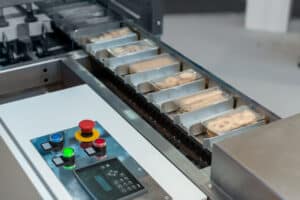
X-ray inspection systems, at their most basic level, detect foreign objects such as metal, stone, or glass contaminants. Additionally, the X-ray image can also be used to verify the integrity of the product. As with the checkweigher, frequent product rejects can indicate an issue with upstream equipment. However, X-ray inspection can probe deeper into the specific issue. Take, for example, a four-pack of yogurts. If one of the filler valves has become partially blocked, one of the four pots will be repeatedly underfilled. This underfill may not be sufficient for a checkweigher to identify the overall product as being underweight. But, by measuring the mass of each pot individually using X-ray zoned mass inspection, the four individual masses can be reported to the supervisory system, and any deviations from the production norms can be identified rapidly.
X-ray inspection can also be used to determine if components are broken. If a misaligned tool is causing a high proportion of cookies to be broken when placed into the packaging, this would likely not be caught until customer complaints began to be received. In a connected environment, the frequency of breakages could be reported back, and warning thresholds, set lower than an automatic reject threshold, could be applied to warn of an issue.
See also: Think Big, Start Small: An Assembly Line for Smart Manufacturing
Using metadata to improve the production line
In addition to collecting a more granular result for quality inspection, additional metadata about a product can be collected. For example, an X-ray inspection system may be used to determine the correct number of components are in a container. This, combined with a checkweigher, ensures that the correct package weight is maintained and the product is supplied as expected. However, it may be of interest to the manufacturer to know what the average size distribution of the products is.
With a pack of four baking potatoes, for example, the total weight and the total number of potatoes is controlled, and any packs found to be non-conformant are rejected. But a pack containing three small and one large potato, while acceptable, is not as desirable as four similarly sized potatoes. Therefore, the size of each potato can be recorded by the X-ray system, and this can be made available for analysis, even if the data is not itself used to make a rejection decision. It may be decided at a later date that, in fact, this should be made a criterion for rejection – at which point historic data is available to allow a data-driven decision to be made regarding acceptable tolerances.
One of the core elements behind Industry 4.0 is a drive towards traceability. The ability to follow a product from ‘farm to fork’ requires data being allocated to the correct item. This means, in addition to the inspection equipment passing data to a server, a server must be able to link this data to specific upstream details. At present, it is a largely manual, time-consuming process to determine which supplier provided the raw materials that have then been processed and packaged. If, for example, an elevated rate of rejects due to bone contamination was observed in fish fillets or chicken breasts, it may be difficult to determine which supplier provided this non-conformant material.
If the details from each unique inspection were fed back to a central database, which already had knowledge of which starting material batch was used and which intermediate equipment the product had passed through, it would be easy to determine how and why issues had arisen. As we move towards a more connected factory, it becomes possible to label a product with details of not only where the raw materials came from but which mixers, ovens, and packaging machines were used. In the event of having to place a product on hold – or, worse, a recall – this increasingly granular level of detail allows the scale of the hold to be reduced.
As the quantity of data increases, the number and complexity of tools required for analysis will increase. While analyzing trends in individual data streams can provide an early warning of equipment going out of range, the real value comes from combining data. Does the operation of one piece of equipment affect the behavior of a neighboring piece of equipment, for example, leading to a nonconformant product? By bringing a broad range of data into a single location, in real time, temporal and environmental factors can be more easily correlated with issues.
At a most basic level, by collecting the data used by inspection systems to make a good/bad decision rather than just receiving a result, intermediate warning thresholds can be set. However, as more and more equipment is connected, the large amount of interconnected data allows for unprecedented levels of analysis and identification of potentially complex root causes of problems.