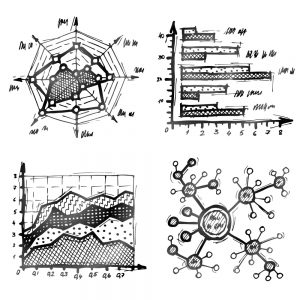
The only way to industrialize the power of analytics is to pair it with equally effective visualization. It helps the users understand the intuition behind the analytics and focus on the areas that need attention.
Excellent analysis, if not presented well, becomes practically unusable. The only way to industrialize the power of analytics is to pair it with equally effective visualization. Effective data visualization brings explainability to the analytics findings. It helps the users understand the intuition and the thought processes that went into deriving the findings.
If designed carefully, visualization can ease the task of inferring a complex analysis. In this document, we present three case studies to demonstrate the power of visual analytics. We have chosen these case studies to highlight how large, complex data can be rendered through effective metaphors and how insights can be derived with ease.
See also: The 5 Most Common Data Visualization Mistakes
Case study #1: Uber rides
Uber uses data-dense visualizations to analyze commutes across a region based on daily, weekly, monthly statistics. It also performs real-time analysis of pick-and-drops and customer trips to understand demand, traffic patterns, inefficiencies, etc. These visualizations rely solely on the raw, real-time data flowing through their network.
Maps are usually the best metaphor for displaying geographical data. Uber has used maps in creative ways by developing interesting layers on top of maps to overlay various statistical observations on maps and adapt to real-time feeds. Consider an example of rendering vertical bars on the geographical maps where the height of a location indicates the number of rides picked up from that location. This visualization helps find pick-up hot spots, morning and evening patterns, among others.
Case study #2: Pandemic statistics
Fighting a pandemic requires continuous monitoring of the infections across the world to plan and take corrective actions. Visual Capitalist analyzes the growth trajectories of a number of cases across days and across regions. Such use cases require the utmost adaptations possible. Furthermore, this visualization needs to get updated on a timely basis as case numbers are published.
There is no need for fancy visualization when a simple line chart can do the trick. Line charts are very effective in showing change over time. The chart can be made effective by supporting different forms of filters and aggregation and the ability to zoom in and zoom out. The shape of the curve itself speaks for trends, outliers, and changes in behavior. Visual Capitalist very effectively uses line-charts to plot a number of cases across regions. It uses the trends and patterns of these curves to derive insights about a region’s success in fighting the pandemic.
Case study #3: Wind map
Another example where visualization plays a very effective role is in identifying the site for a wind farm. The velocity and direction of wind play a key role in not just selecting a site for a wind farm but also selecting suitable wind turbines and optimum installation height to maximize the output. Ventusky very effectively uses wind maps for this purpose.

Speed is represented by lines moving slow or fast, and the direction is represented by which way the lines are moving. Ventusky overlays this with additional data such as cloudiness, temperature, and air pressure. Such visualizations prove to be a strong tool where decision-making is done on the basis of atmospheric factors.
Visualization by design
With the increasing digitization, all industries are trying to tap into the power that data analytics can unleash. However, the lack of explainability directly impacts the confidence and the rate of adoption of complex analytics findings. The only way to industrialize the power of analytics is to pair it with equally effective visualization. It helps the users understand the intuition behind the analytics and focus on the areas that need attention.


