

Simply put, Murphy’s Law states that “Whatever can go wrong, will go wrong.”While there is no single point where the law came into being, with potential historical references as far back as 1877, Murphy’s Law is unmatched in its applicability to many fields. One can find Murphy’s Laws on multiple categories: cooking, cars, the military, even love. But Murphy’s Law finds its real home in technology, and in today’s increasingly complex, technology-driven world, the laws have found a new home in observability.
So what is observability? In short, observability is a mindset that enables us to answer any question about our business through the collection and analysis of data. Observability includes the new and deeper sources of data from systems, applications, and infrastructure that allow us to gain insights into the actions of those environments. It also lets us infer what is going on in those systems, from any aspect, and at any phase. The more observable a system is, the quicker we can understand its activity and respond to changes or issues.
Of course, our observability practice can vary, and as Murphy points out, things can go wrong. However, if we take the time to think about how things might go wrong using the broad reach of Murphy’s Laws, we can maintain control and avoid finding out what went awry the hard way, at the worst possible time. Here are four of Murphy’s Laws that speak directly to our complicated practice of observability, so teams can better equip their environments for all circumstances.
Law #1: “If you perceive that there are four possible ways in which a procedure can go wrong and circumvent these, then a fifth way, unprepared for, will promptly develop.”
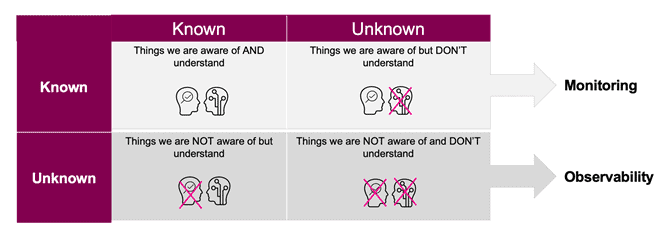
Since becoming a common term for DevOps engineers, developers, and site reliability engineers (SREs), observability has been tied to a concept of “unknown unknowns,” or dealing with things that we didn’t even consider as a potential concern. After all, if we knew about it, to begin with, then we’d probably already be monitoring for it.
Observability is all about the data. Generally, that data falls into three classes: metrics, distributed traces, and logs. The more observability data you have, the easier you can understand what is going on with that “fifth way.”
What does that buy us? In the past, much of our data about applications and infrastructure was limited to “Is it alive?”. Yes, this is important to know — as a great study from EuroControl shows us, our systems mostly work fine. We need to be able to reassure ourselves that things aren’t broken. We can learn from our successes and work to expand our good known-known outcomes.
On the other hand, when something does go wrong, we need to be able to respond quickly and correctly. To do this, we need deeper data from all useful sources. Observability gives us that deep data. As much as we would like to believe that all is perfect within our infrastructures, it seldom is, especially where applications are concerned. As Murphy might say, “If anything cannot go wrong, it will anyway,” and it will be in the place you least expect.
Observability is all about data, specifically data that gives us information on how well our systems are performing. However, data is only useful when we can aggregate, analyze, visualize and respond to it. What started as a simple view has grown into complexity, just as our underlying applications and infrastructures have changed in a cloud-native world.
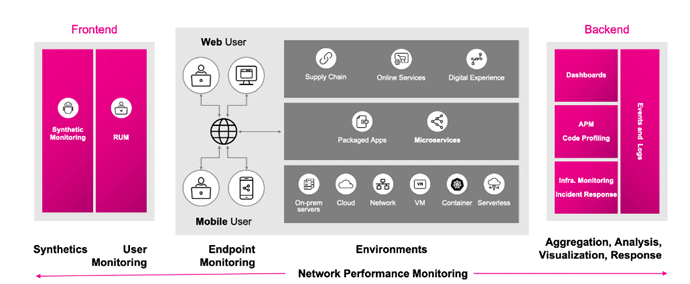
We now have many different aspects that we need to analyze and visualize during a user’s path through the system. We need to establish that it works, that it is still working, and what the impact of changes are at each step. While individual views like synthetics, RUM, APM, or infrastructure may be of primary use to specific groups or within functions like test or in production monitoring, the data delivered by observability practices encompass the entire realm.
Law #2: “If it is not in the computer, it doesn’t exist.”
This one already relates to technology, but it is a great descriptor of some things that have to be considered in observability — and yes, it still relates back to our data. There are two areas that we should pay attention to with our data: sampling and precision.
Let’s start with sampling. With our new complex systems, we generate a lot of data, and it seems like a sampling approach would help reduce that data load. But think of it this way, sampling changes the underlying analysis and visualization. Linear or low-pass filtering smooths your visualization. That destroys the sharp edges, and the loss of those sharp edges might be just what cuts you. Bandpass filtering removes the outliers or, conversely, removes the baseline, which might make things look better or worse than actuality. Sampling, either head or tail-based, removes data that might be useful in the future. After all, we’re going to be attempting to resolve issues that we didn’t suspect, that are those unknown unknowns. Why would you let someone else pick what they think is important based on things that they (and you) don’t know?
Sampling, on the other hand, gives you a selection bias. It misses things that are out of range and that analysis and visualization make you think your duration is maxed at two seconds.
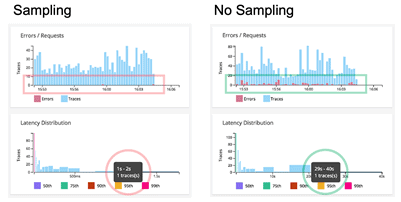
But when we look at the unsampled data, we find that the duration is up to 40 seconds. In our instant-gratification society, 40 seconds is a lost sale.
It’s not just about what is going wrong; you also need to know what’s going right — knowing your baseline is as important as knowing your outliers. Basically, you can’t know if something is “bad” if you don’t know what good looks like. You can’t investigate if you don’t have all the data, and missing data may mean you can’t answer the questions that the unknown unknowns raise.
It’s important in beating Murphy that every data point is valid unless you specifically set up aggregations that are practical and help eliminate false positives. Remember that data resolution, the rate at which data is ingested, is not equal to reporting interval, the rate that data is displayed.
Law #3: “Things get worse under pressure.”
It’s all about scale these days. Our infrastructure is no longer one application or one server. In fact, our applications are no longer one block of code either but are made up of microservices and third-party services tied together with some communications protocol.
It’s not unusual to see infrastructures that consist of thousands of servers. And yet, we need to be focused on the individual elements as much as we are on the overall environment.
Observability provides us with the data to see any individual element accurately and precisely dependent on your ingest strategy, and our aggregation can show us the overview. With the proper data and understanding of our limits, we can even help proactively prevent problems. After all, sometimes you just want to know what’s coming.
However, item scale is only part of the issue. System scale is multi-dimensional. Such things as Kubernetes objects, frequency of deployments cardinality, artificial intelligence (AI) interactions, even our microservices, and third-party services continually scale both up and down.
The concern is that we have two dimensions moving at the same time. We have changes to our applications — microservices and containers — while we increasingly have elastic and ephemeral behavior in our infrastructure — orchestration, serverless and elastic. We have moved from the simple to the complex, where we need to probe, sense, and respond.
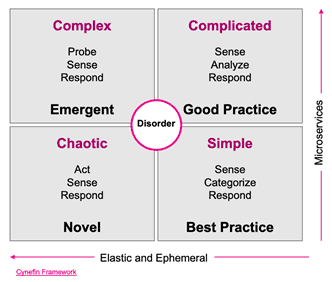
Fortunately, observability gives us the ability to do that when the data is properly correlated. In short, this means that any discovery exercise should be transferable to a different phase without repeating steps. Observability gives us the capability to make that complex, emergent space approachable and enables best practices.
Law #4: “All’s well that ends.”
One of my favorite quotes is from Brian Kernighan, in Unix for Beginners (1979): “The most effective debugging tool is still careful thought, coupled with judiciously placed print statements.”
Observability is our new print statement, and it gives us the data needed for our insights, driven by our careful thoughts.
So, while Murphy may have a lot of insight into how our environment works, observability can help reduce the impact of things that go wrong. Properly applied, observability gives us better control, accurate responses, and happier customers. After all, it’s fun to be able to beat Murphy at his own game.