

“Big Data” has gained a lot of momentum recently. Vast amounts of operational data are collected and stored in Hadoop and other platforms on which historical analysis is conducted. Business intelligence tools and distributed statistical computing are used to find new patterns in this data and gain new insights and knowledge for a variety of use cases: promotions, up- and cross-sell campaigns, improved customer experience, or fraud detection.
One of the key challenges in such environments is to quickly turn these newfound insights and patterns into action while processing operational business data in real time. This is necessary to keep customers happy, increase revenue, optimize margin, or prevent fraud when it matters most.
An event processing approach known as “fast data” automates decisions and initiates actions in real-time, based on statistical insights from Big Data platforms. This article explains how to achieve a closed loop for real-time analytics with Big Data and machine learning and analytic models, and event-processing engines. Different open-source frameworks and commercial alternatives will be discussed.
Use cases for real-time event processing
Before we take a look into technologies, let’s think about some use cases where it is important to analyze and act on critical business moments while the data is still in motion. The window of opportunity might be a few seconds, minutes or even hours. The key is to be proactive (automatically or via human interaction) based on predictions, which are calculated in real time by an analytic model (see Figure 1):
- Optimized pricing: Offer a product, hotel or flight for the best price, i.e. to make most revenue. It should be lower than the competition, but also not too low. If it is sold for too low a price, you create less revenue.
- Fraud detection: Decide if a payment is accepted or rejected, e.g. in a store or online sales, before the fraud has happened.
- Cross selling: Send an offer (e.g. via push message to the mobile device) while the customer is still in the store. If the customer has left the store, he will spend his money somewhere else.
- Rerouting transportation: Act on logistic events that are not foreseeable hours before – for example, traffic congestion due to weather or accidents.
- Customer service: Recommend the best solution for a customer while he is in the line – g., solve a problem in the appropriate way based on the customer’s history, knowledge and loyalty status.
- Proactive maintenance: Stop and replace a part before the machine will (probably) break. This can save a lot of money and efforts.
- Restock inventory: Ship inventory to specific shops based on expectations, external influences, and customer behavior.
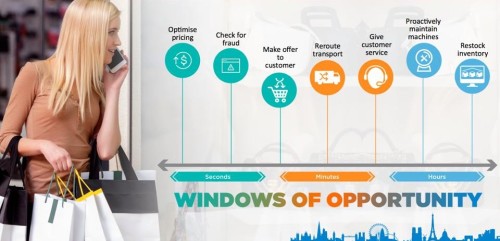
Figure 1
The decisions to act proactively are done by leveraging historical data and building analytic models based on this data. Let’s take a closer look at this in the next section.
Analytics maturity model
Figure 2 shows the closed loop necessary to find insights and pattern in historical data, build analytic models for prediction, and execute the analytic models on new events automatically. The new events are also stored for future historical analysis and optimizations of the analytic model and re-deployment.
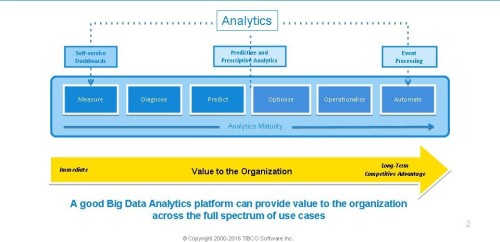
Figure 2
The following sections describe the three phases of the analytics maturity model in more detail:
- Phase 1: Data discovery using visualization by the business user.
- Phase 2: Predictive and prescriptive analytics using machine learning by the data scientist.
- Phase 3: Operationalization and automation using event processing by the developer.
Phase 1: Data discovery using visualization
“The greatest value of a picture is when it forces us to notice what we never expected to see” is what John W. Tukey said in 1977, long before the era of Big Data analytics. The questions businesses should ask in the first phase are: What happened? Why did it happen?
The business user has to follow these steps:
- Data acquisition: Integrate relevant data sources. These can be CSV files, a relational database, a data warehouse, or Big Data storage such as a Hadoop cluster. Using these data sources should be very easy via graphical out-of-the-box connectors to let businesses focus on discovering business insights.
- Data preparation: Usually, you have to merge different data sets to get valuable insights. The real insights are found by (often unexpected) correlations of different data. The output of data preparation is often just flat files with rows and columns (like a simple CSV file, but often with very large data sets), These files can be used easily for extensive analysis.
- Exploratory data analysis: The business user uses the integrated and prepared data to spot problems and new insights. Ease-of-use of the tool is key for success (e.g. using a recommendation engine that suggests specific visualizations for selected columns, or interactive brush-linking between different tables and charts).
“A picture is worth more a thousand tables” describes how relevant visualization is for humans. A business user is not technical expert or developer. He needs an easy-to-use tool for data discovery (whether Tableau, Qlik Sense, or our product, TIBCO Spotfire).
A data discovery tool might be enough for a business user to find problems, new insights or patterns in historical data. But for analyzing Big Data, he often needs help from a data scientist who can use machine learning algorithms to create analytic models.
Phase 2: Predictive and prescriptive analytics using machine learning
The data scientist focuses on the question: What will happen? He can create predictive analytic models that can be leveraged by the business user to find insights in Big Data stores.
Let’s explain machine learning a bit before discussing the role of a data scientist. If you use the Internet, chances are very high that one of the websites you visit leverages machine learning under the hood. Every Google search, Facebook timeline, Netflix movie recommendation or Amazon product recommendation is calculated based on analytic models to show the best context-specific, personalized information to you.
Machine learning is a method of data analysis that automates analytical model building. Think about spam detection, credit card fraud protection, product recommendation, or recognition of pictures or handwritten letters. In such cases, machine learning allows computers to find hidden insights without being explicitly programmed where to look. For that, it uses algorithms such as linear regression, random forest or k-means clustering to iteratively learn from data. The developer (i.e. data scientist) does not have to write everything in code (e.g. using “if-else” or “for” loops). The code learns itself! This is necessary, as the developer cannot implement every rule or condition in the mentioned use cases.
All tech giants already use machine learning heavily. Other enterprises are getting started, and there is no way around using machine learning if an enterprise wants to be competitive in a few years. In the above analytics maturity model, the data scientist has to do the following steps in this second phase — while working closely together with the business user:
- Analytic model building: One size does not fit all! Many different machine learning algorithms are available, and the number is growing these days massively. A data scientist usually tries out different alternatives and repeats different approaches iteratively to find and create the best analytic model.
- Analytic model validation: This is key for success. Is the model really working well, also with new inputs? After training a machine learning algorithm initially with some historical data, you have to use another part of the historical data (e.g. split 90:10 before) to validate the model. Afterwards, you can either improve the model by changing variables, formulas, or by changing the complete algorithm. Even if the model is good enough to deploy for real-time event processing, it is still revalidated later with new data to improve it further.
Figure 3 gives an overview about different machine learning alternatives for data scientists (no complete list).
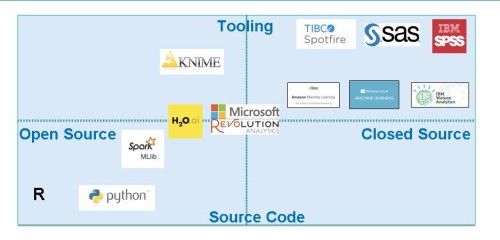
Figure 3
- R Language: Well known as the most popular free and open-source programming language used by data scientists for modeling. It is developing very rapidly with a very active community. R comes from the academic world and was not build for enterprise production, scalability or high performance. Therefore, an enterprise product on top of R is often used instead of just deploying open-source R code for production with better performance. Another issue with R is the restrictive open-source GPL license, which might be a hindrance if you want to “resell some R code” within a product to other customers.
- Python: The other widespread language for machine learning. It emphasizes ease-of-use, productivity and code reliability. Therefore, its syntax is “nicer” and easier to learn than R, but its primary focus – in contrary to R – is not statistics and predictive analytics. Rather, it is a multi-purpose language in which machine learning is just a small part.
- Apache Spark: A general scalable data-processing framework, which includes machine learning, graph processing, SQL support and streaming features. However, the focus in most projects today is especially on analytics using its machine learning library, MLlib. It consists of common learning algorithms and utilities, as well as lower-level optimization primitives and higher-level pipeline APIs.
- H2O: An extensible open-source platform for analytics. It leverages best of breed open source technology such as Hadoop, Spark, R, and others. Its goal is to offer massively scalable Big Data analytics with very high performance for real-time scoring.
Machine learning software
- Microsoft’s Revolution Analytics: A statistical software company focused on developing open source and “open-core” versions (i.e. commercial add-ons and support) of the R language for enterprise, academic and analytics customers. Microsoft – who acquired it in 2015 – is rebranding the software and releasing new products and features.
- TIBCO Spotfire + TERR (Enterprise Runtime for R): Rewritten R as a commercial compute engine to overcome the restrictive GPL license and to offer enterprise-grade scalability and performance. Can be used as single runtime, but is also integrated into TIBCO’s data discovery tool Spotfire.
- KNIME: An open-source data analytics, reporting, and integration platform. It integrates various components for machine learning and data mining through its modular data-pipelining concept. A graphical user interface allows assembly of nodes for data preprocessing for modeling, data analysis and visualization. It is often combined with languages such as R or other tools such as TIBCO Spotfire.
- SAS: Commercial vendor for building analytics models. One of the leaders in the market.
- IBM SPSS: Another leading product in the analytics market, offered by the mega-vendor IBM.
- Amazon Machine Learning: A managed Software-as-a-Service (SaaS) offering for building machine learning models and generating predictions. Integrated into the corresponding cloud ecosystem of Amazon Web Services. It’s easy to use, but has a limited feature set and potential latency issues if combined with external data or applications.
- Machine learning offerings are also available from many other cloud vendors, e.g. Microsoft Azure, IBM Watson Analytics, or HP Haven OnDemand.
PMML (Predictive Model Markup Language)
PMML is the XML-based de facto standard to represent predictive analytic models. It is developed by the Data Mining Group (DMG), which includes several software vendors. The main goal is to offer a standard to easily share models between PMML compliant applications (e.g. use SAS for model creation and deploy the same analytic model without rebuilding to TIBCO StreamBase for real-time event processing).
Business user + data scientist = smart!
The business user must be able to leverage the analytic models. Therefore, a data discovery tool has to be able to integrate different analytic models.
The business user does not care which kind of algorithm or machine learning model is used under the hood. He just wants to use it to find new insights. Figure 4 shows an example of TIBCO Spotfire, where the user can select different variables (i.e. features of an analytic model) and then run this model on the data set by clicking a button on the user interface.
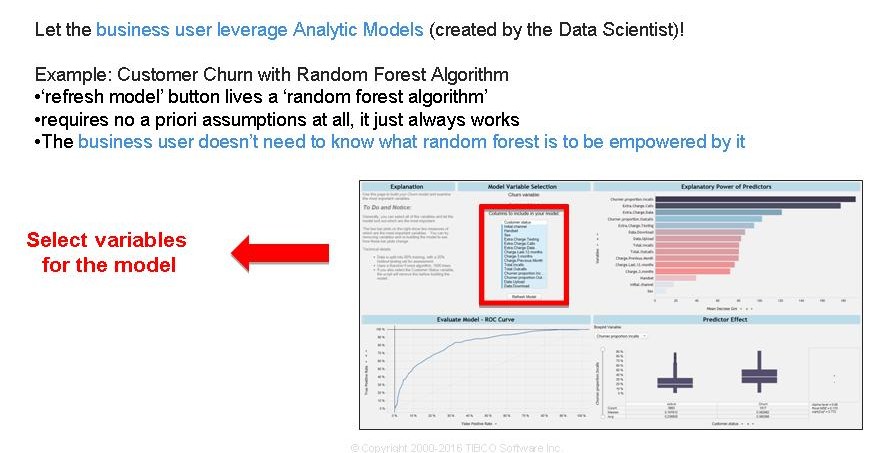
Figure 4
Phase 3: Operations and automation with event processing
Insights and patterns found by a business user (leveraging an analytic model created by the data scientist) is a good beginning. However, it only creates business value if you are able to execute the model on future events in real time. Therefore, the key question in the third phase of our analytics maturity model is: What should I do?
The developer has to integrate the analytic model into real-time event processing to automatically monitor real-time transactions and trigger actions (e.g. for cross-selling, fraud detection or predictive maintenance). This phase includes two parts to implement: machine-to-machine automation and enablement of human interactions.
- Machine-to-machine automation: Automated action based on analytic models of history combined with live context and business rules. The Challenge: Create, understand, and deploy algorithms and rules that automate key business reactions.
- Human interactions: Human decisions in real time informed by up-to-date information via pushed events. The challenge: Empower operations staff to see and seize key business moments.
Let’s discuss both parts in more detail:
Machine-to-machine automation
Several open-source frameworks and commercial tools are available to realize machine-to-machine automation, which is also called stream processing or streaming analytics in this context. Figure 5 shows some alternatives (no complete list).
Some available open-source frameworks are Apache Storm, Apache Flink, Apache Samza, and Apache Spark Streaming. Several cloud vendors also offer closed-source frameworks, e.g. Amazon Web Services’ Kinesis or Microsoft Azure’s Stream Analytics. Commercial offerings include products such as IBM Infosphere Streams, TIBCO StreamBase or Software AG’s Apama. Let’s point out the key differences between frameworks (both open source and closed source):
Stream processing frameworks include:
- Library (Java, .NET, Python)
- Query Language (often similar to SQL, but with additional features such as sliding windows and continuous queries)
- Scalability (horizontal and vertical, fail over)
- Connectivity (technologies, markets, products)
- Operators (filter, sort, aggregate)
Stream processing product features (in addition to the above):
- Visual IDE (dev, test, debug)
- Simulation (feed testing, test generation)
- Live UI (monitoring, proactive interaction)
- Maturity (mission-critical deployments for years, 24/7 support, consulting)
- Integration (out-of-the-box support for Enterprise Service Bus, Master Data Management, and other middleware)
Applying analytic models to real-time event processing without rebuilding
Event processing is used to operationalize insights and patterns in real time without rebuilding the analytic models. Figure 5 shows the relevance of reusing the existing models built by the data scientist and business user and take them into action.
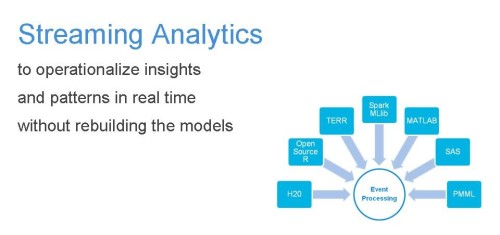
Figure 5
Many enterprises let the data scientists build an analytic model with their favorite tool. The model itself validates and works. However, the enterprise cannot take it into action easily. Often, the model has to be rebuilt (i.e. re-implemented / re-coded) with another language or technology. That’s a costly and not really agile way of building, validating, and then deploying models to real-time event processing. Be sure that you can leverage a model and deploy it to action without rebuilding it!
Fast execution is another relevant aspect, as you usually need to apply the analytic model to every new event. No matter if it’s e-commerce interactions, predictive maintenance, or any other scenario, you will probably have to process hundreds, thousands or even millions of events each second or minute. The execution time of scoring an event depends on the technologies, languages, frameworks and tools you use for building the analytic model. Some frameworks are built especially for very high velocity. For example, we use analytic models built with H2O and score them in TIBCO StreamBase in less than 30 milliseconds.
Human Interactions
On top of stream processing or complex-event processing in general, you often need a human to make the final decision. Think about predictive maintenance where replacing a part might costs thousands of dollars. However, the analytic model of the data scientist just offers you a specific probability if the machine will break. A human can take a deeper look in both, live and historical data, to decide if a part will be replaced or not.
A live visualization pushes events in real time to a user interface (e.g. desktop, web browser or mobile device). The operations team can live-monitor systems and see exceptions or errors when or even before they occur (using the analytic models). Thus, they can do proactive actions – e.g. stop a machine or send a mechanic.
You can create such a live user interface with open-source technologies such as HTML5, JavaScript, WebSockets and web frameworks such as AngularJS. Or you use a product built specifically for that purpose, e.g. TIBCO Live Datamart.
A Big Data machine learning architecture
Figure 6 shows a complete Big Data architecture.
The red boxes represent components for historical analysis such as a Big Data store (e.g. Hadoop), a data discovery tool (e.g. TIBCO Spotfire) and machine- learning frameworks (e.g. R, Apache Spark or H2O).
The blue boxes represent the event processing components and include event processing (e.g. Apache Storm or IBM InfoSphere Streams) and the live user interface for operations (e.g. TIBCO Live Datamart). Other middleware might complete the architecture, for example an Enterprise Service Bus if you need to integrate transactional systems such as ERP, CRM or Mainframes.
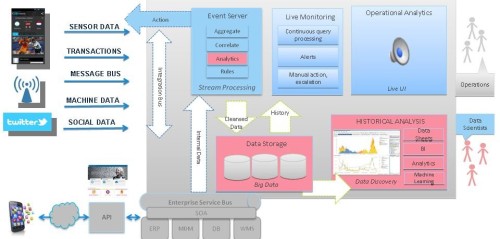
Figure 6
A closed loop for Big Data analytics is key for success
Business users and data scientists have to work together closely to build and validate analytic models. These models have to be deployable into a real-time event processing engine without rebuilding the model. Manual or automated re-validation and re-deployment of an improved model closes the analytics loop. If you want to implement a closed loop of Big Data analytics to create analytic models with machine learning and deploy them into real-time event processing, then you should focus on ease-of-use, time-to-market, flexibility and extensibility of the tool chain.
On a final note, even though this article focuses on stream processing, the described ideas are also relevant for other kinds of event processing. For example, rule-based event processing –e.g. with JBoss Drools CEP Engine or TIBCO Business Events — might be the right choice in your specific use case.
More images and details are available from my March 2016 presentation at Voxxed Zurich in Switzerland: “How to Apply Big Data Analytics and Machine Learning to Real Time Event Processing?” A video recording can be found here.
Related:
How to avoid the anti-pattern in analytics: three keys for machine learning
How real-time algorithms are central to Netflix’s business model
Special report: Frontiers in artificial intelligence for the IoT
Want more? Check out our most-read content:
Fog Computing: A Reference Architecture
IoT Architectures for Edge Analytics
Data Streaming at the Edge: IBM and Apache Quarks
Liked this article? Share it with your colleagues!