Striim outlines a streaming analytics approach starting with data capture and moving to real-time intelligence.
How do companies move from capturing data to streaming analytics?
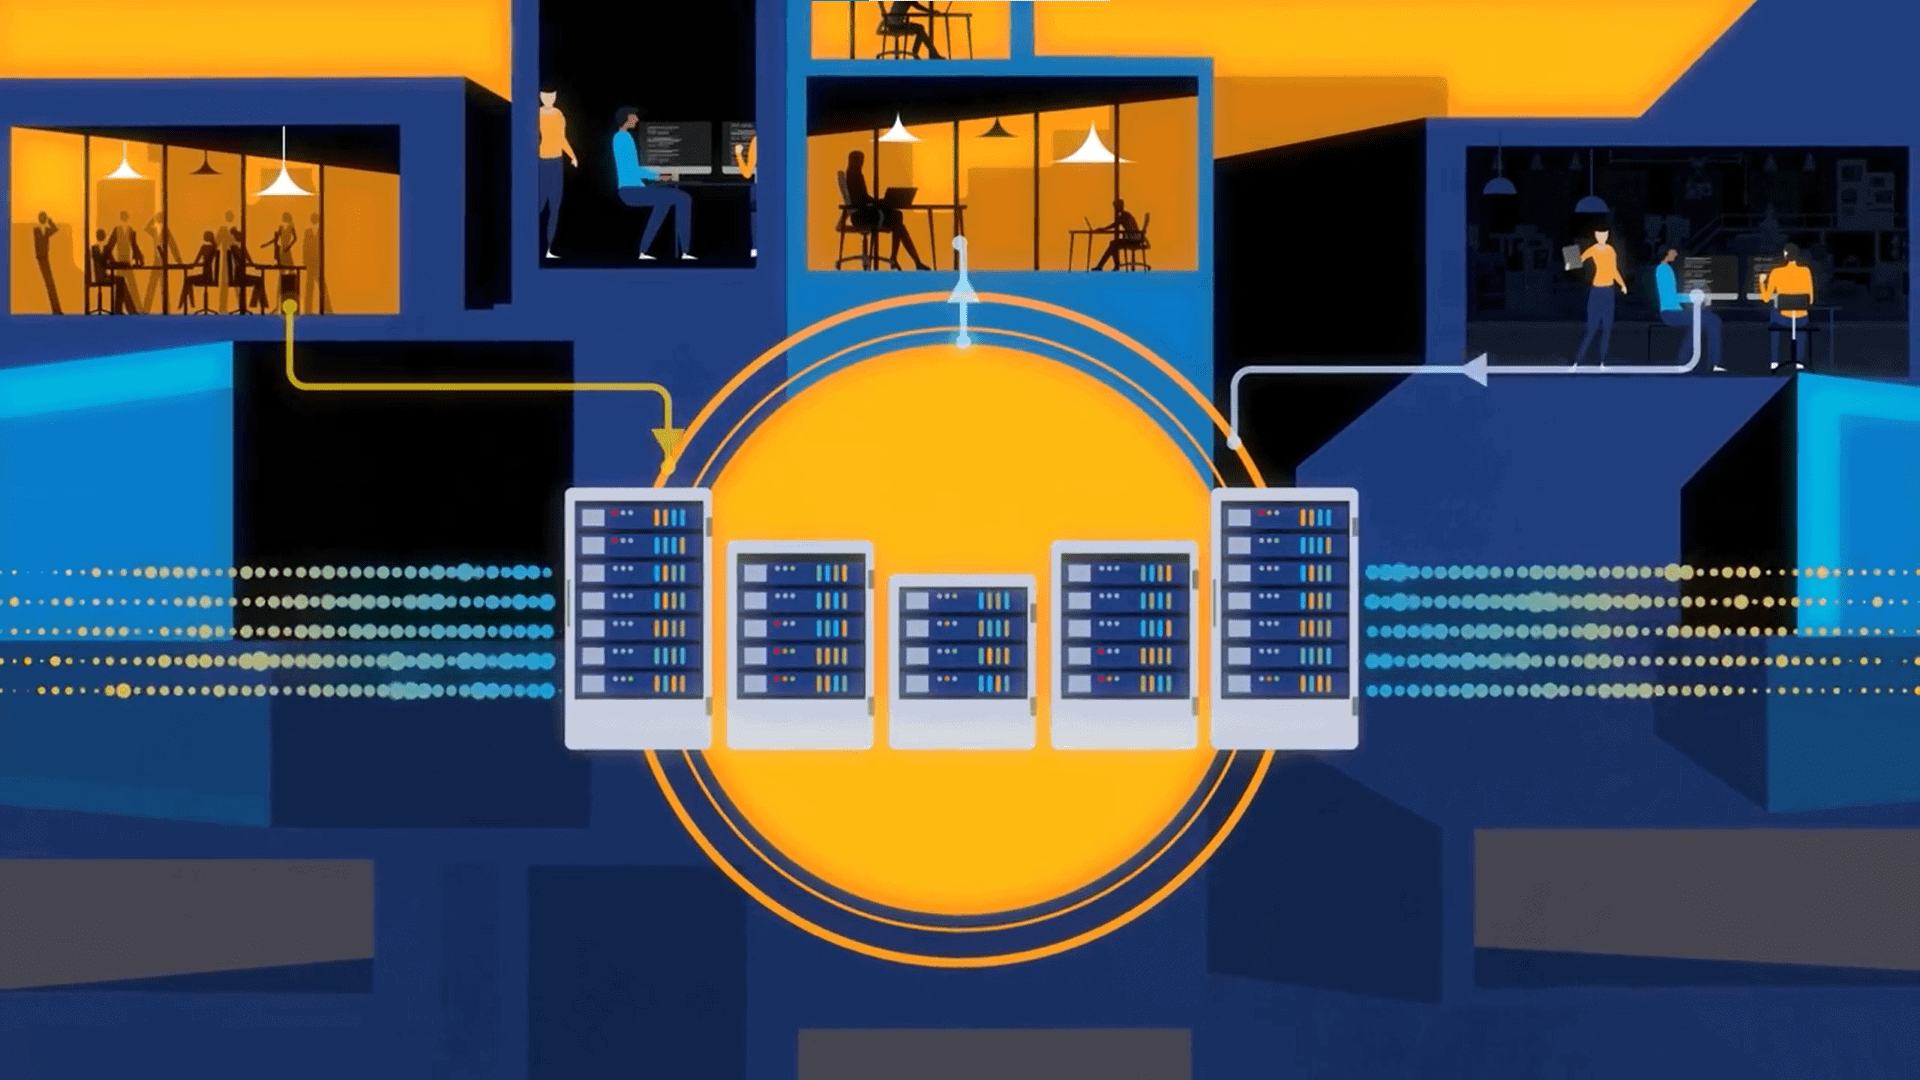
According to Striim, the first step is to capture and integrate data from various sources, whether that’s a CPU, or changes to a database, or an IoT device. Next, add intelligence as that data flows in, doing analytics on the stream itself through a query. Now you have streaming intelligence.
What are the benefits? Multiple streams of data can be analyzed. For instance, with IT monitoring, streaming analytics can correlate real-time data from different sources, whether a CPU, database, or weblogs. That can give a business a good view of what’s happening in a data center. Another use case: e-commerce. Web session data can show how long a customer’s shopping cart has been abandoned, which could prompt an online retailer to push an incentive. Then, of course, there’s IoT data from different devices.
In the video below, Steve Wilkes, CTO of Striim, explains to Adrian Bowles, RTInsights executive analyst, how integration and intelligence can be brought together in a streaming analytics platform. Use cases are also explored.
Transcript:
Adrian: Back to Palo Alto and we have Steve Wilkes, CTO and one of the founders of Striim and what I’d like to do is, for the folks that are watching that aren’t really familiar with your company, can you give us just a minute in terms of the background? When was it founded and what are you trying to accomplish here?
Steve: Well Striim was founded in 2012 and four of us that previously worked together at Golden Gate Software came together to form Striim. Golden Gate Software was acquired by Oracle in 2009 and it was in the business of moving database transactions from one database to another and in doing that, there was a number of different business use cases that we saw, from creating a database replica or creating a read-only instance, etc, etc. While we were talking to our customers, something that came up pretty often was, you guys are great at moving data, can we look at it while it’s moving? Can we make decisions on that moving data?
Don’t forget, this was data from databases, this was looking at a database and enterprise applications are running against that database, and seeing every insert, update, delete as it actually happened, so really being able to kind of tap into what was happening, the activity in that database and see that in real time. Golden Gate was just moving it into another database. What we thought was, if you could analyze that, then you could get real-time insight into what was happening in the enterprise. That was kind of the genesis of the idea and we wanted to build an end-to-end platform because we didn’t want customers to have to play around with putting together lots of different bits of software to get a solution.
We wanted to go from capturing the data, processing it, analyzing it, maybe delivering it somewhere else and then being able to visualize it and alert off it if there’s any issues. That was in 2012 and it was a fairly ambitious goal — to build this big end to end platform. Fast forward almost four years and we’ve built that platform. We can now source data from lots of different sources, not just change data capture from databases but also your log files, message buses, Kafka, IoT devices.
Anything that can produce data, we can get data from it and then it goes into kind of the processing side, where you can start looking at it and analyzing that data, maybe before delivering it somewhere else or visualizing it in a dashboard. That ambitious goal of an end-to-end platform, we’ve actually done that and we’re very proud of it.
Adrian: Okay, great. When you were talking about analyzing it as it’s in motion, what comes to mind is the more traditional way pre-2012, let’s say, in the olden days, is you would have data in a location, you’d look at it. Now there’s a lot of issues with streaming data anyway, IoT sorts of devices and sensors and things like that, but it sounds to me that you’re also taking data that wouldn’t normally be thought of as streaming data and as you’re moving it, that’s the stream that you’re creating and analyzing at the same time. Is that accurate or am I misunderstanding where you’re going with that.
Steve: Absolutely. To us all the data’s streaming. We’re an in-memory platform and all of the analysis you’re doing against the data is in the form of queries. You write a continuous query, it looks like a select statement and that query allows you to process the data, so if you want to do like a filter … you want to do aggregation, then you’ll do a group …but you’re going to do that over a window, and we’ll talk about that later. If you want to do transformation of data, you use column functions, right?
Things that would be familiar to people writing against a database, you can also do that against a stream but you have to bear in mind that these streams are kind of infinite, unbounded and once you write a query, all the stream data is going to flow through it. It’s not like a database where you write a query against a table and you get a result sent back. Here you write the query and throw the data through it. As long as there’s more data, the query will keep on producing results endlessly. That’s kind of how we do the processing.
If you go back and you think, well how do you get that streaming data, that was really one of the key differentiators about our platform. … Other vendors in the space will often say, well we can analyze it, as long as it’s on Kafka. They’re not really going back and seeing how do you get to that data in the first place. You’re right. Some data is inherently streaming. You think of Kafka and you think of a message queue, that’s what most people think of as streaming data, right? You also have a direct connection through TCP socket and stream data through it that way.
If you think of databases, most people don’t think of those as streaming and that’s really where the heritage from Golden Gate kind of helped us out because we were already thinking of databases as a source of change events. That [changing] event stream is the database activity, so by using change data capture as part of our platform, being able to look at the change, the activity that’s happening in an Oracle database or a MySQL database, even the HP Nonstop — even those databases we can do change data capture.
It’s kind of interesting because when we first built the platform, we built something that was like a full streaming platform. I mentioned we wanted to do end to end, everything from collection, reprocessing, delivery and visualization. As customers started using the platform, then we saw that we really had to differentiate these, there were two aspects to that. One was what we call streaming integration, which is where you’re collecting the data and being able to process it and move it.
Then there’s the kind of streaming intelligence, which is the analytic side, where you’re starting to look for patterns and look for deeper analytics on that to really understand what’s happening right now and be able to visualize it. Incidentally, that’s where the two “I’s in the Striim come from — it’s integration and intelligence.
Adrian: Okay. You talked about the second ‘I’ being intelligence. Can you give me just a little more depth in that, in terms of what sort of analytics are you dealing with here? Is it all internal, is that customer facing, how does the analysis work?
Steve: There’s a number of different ways that you can do analytics. The first one is correlation, where you’re looking for things that match and they can match in time. An example would be that you have two streams coming in — they’re going to two 30-second windows. Then you can join those two together using some correlator, maybe IP address, for example. You’re saying: If anything that happens in this data stream, I’m looking for something that matches it within 30 seconds in this other data stream and vice versa. You can do that kind of correlation.
We have customers doing that today for pretty complex network address translation look-ups and we see that all the time with our customers, that once you have a stream of data or you have multiple streams of data, you can start to think of different purposes for them. When you start joining things together, you can get even more interesting things, like you’re monitoring your web logs, if you join that with a stream that’s monitoring kind of the system health, CPUs, disk usage, maybe database activity, you’re starting to get a really good picture of what’s happening in your data center and how things happening maybe on your database server can affect other pieces and get this whole correlation going between different streams.
You can join what they’re doing right now with what they’ve done in the past, and make better decisions. If in the past it seems that while this guy often puts stuff into a shopping cart and then if he leaves, he doesn’t really do anything for like three minutes, he’s going to forget about it and not buy, so we will use that information and if he’s on the site, he’s put stuff in the cart and two minutes has passed, we’ll remind him and tell him that if he buys it now, he’ll get a 5 percent discount. That’s really where the combination of the real-time information joining with historical context is really, really important.
The streaming analytics absolutely requires context because most of the streaming data you get doesn’t have sufficient context for you to work with it. You think of like the call detail records from Telco. If they have like a subscriber identifier, that’s just a hex code, it doesn’t tell you much. If you join that with what you know about the customer, you start to get much more insight into what’s really happening. That’s just like context information, maybe just who the person is, but if that customer also has a model associated with them, based on what you know they’ve done in the past, then you start to get something really, really powerful.
Adrian: Like a behavioral model. Yeah, great. Well thank you for coming in. This is fascinating stuff.
Steve: It’s been a pleasure talking with you.


