

In the time of the pandemic, manufacturing operations looking to pivot production to new items and improve productivity have become more reliant on data historians providing sensor data analytics. Traditionally, only operations teams physically present in plants had access to operational data in control systems, but with widespread remote working and digital transformation initiatives, offsite engineers now require access to data too. Automating the collection of operational data is increasingly important.
Data historians take high-speed sensor readings and record them. Depending on the industry, readings including temperatures, pressure, flow rates, and conveyor speeds are taken constantly, millisecond to millisecond, and then preserved. In recent times with the rise of IIoT device connectivity, collecting and processing that operational data automatically in historians is becoming more affordable and accessible.
Automating data collection key to modernizing
Automating the collection of operational data is especially important in the food and beverage sector, where there are fast production lines and multiple products. In the past, smaller food and beverage manufacturers used a paper-based chart recorder to record sensor measurements. They might have as many as five measurements on a chart recorder. In contrast, automated data collection systems collect and store millions of measurements.
Previously, there was only so much physical space to place that chart recorder, so manufacturers had to be selective about the data recorded. Invariably, they then needed something that wasn’t on the paper. Now, with control systems, IIoT sensors, and edge devices, it is easier to collect and record everything that might be useful for anything from process improvement to troubleshooting. Regulatory reporting is the focus for using historians to store operational data in some industries. Automating the collection and storage of operational data enables businesses to produce the data they need for compliance.
Diagnostics and troubleshooting
The next step is extracting the value from that data. 71% of manufacturers we surveyed said one of the key values of historian data came from diagnostics and troubleshooting. Similarly, 43% said it helped identify process improvement opportunities, and 56% used it to help reduce energy consumption. Automating data collection and analysis reveals patterns and trends that can support and speed up troubleshooting. If operators can find out in 30 seconds what the problem was, instead of in five minutes, then they can correct that much faster.
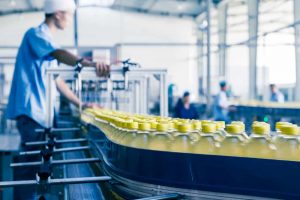
In consumer goods and food and beverage manufacturing, high-speed packaging lines are the norm, and so is jammed packaging material. For example, if a yogurt plant that is producing ten cartons a second is down for a minute, with 100 small faults a day – that’s 600 yogurt cartons affected. Accurate data is also key to downtime tracking, production costing and energy consumption reporting, enabling manufacturers to increase uptime and allocate energy cost to individual production units.
Very often, manufacturers don’t know what they don’t know. Accurate data provides fresh insight. Data can drive productivity and profitability by spotting opportunities for process improvement. For example, a mechanical bag filling application had several steps. The systems integrator committed to supplying a system that would deliver a rate of filling two and a half bags a minute. Then they discovered they were able to fill three and a half bags a minute. At that point, many would have said, “Great, we overachieved, we’re done.”
This particular system integrator recorded the processing steps in the data historian. They ran a report on these processing steps, discovering the number of milliseconds that each operation took on average. This uncovered a wide variation in the time it took to close the bag. They investigated the reasons for the variation and shaved five seconds off of the longest time. That increased production by 20%. Each bag was worth $250, so that translated to almost three-quarters of a million dollars a day worth of increased production.
More Accessible
Traditionally, detailed operational data was only accessible in the control room. While that simplifies some of the security challenges, it is problematic when more and more people could benefit from that data. Increasingly, sites are mirroring it to more accessible systems on the business network or online. This hybrid approach is ideal for improved and more timely decision making by more people. Now engineers can access the data from their mobile phones and from home when they need to. That has proved invaluable in the Covid-19 era.
In less traditional manufacturing applications, the accurate data is still quite valuable, but sites lack the needed infrastructure, staff, and expertise. In developed economies, health and beauty products are sold in large containers. However, in emerging economies, those are too expensive, so products are produced in smaller packaging.
To avoid high distribution costs, local shampoo plants operate from a miniature plant the size of a shipping container. Whereas in North America, there might be four large plants in an emerging economy that would be replaced by 50 shipping container-sized plants. Similarly, some water treatment plants operate in a shipping container, to clean water in remote locations, such as mining operations. There is no room for servers or IT engineers to handle data onsite. But the information is just as valuable to small operations, and using a fully-managed cloud solution makes it cost-effective even for these small sites.
Operations leaders looking to the cloud used to consider security to be a major concern. For some time, there was the perception that on-premise data storage was a more secure option than allowing the data to leave the organization. That has changed. There is increasing recognition of the high level of security of the cloud itself – and secure, send-only data architectures protect outbound data. Cloud data is now safely behind multilayered security that is hard to match in a small, on-premises collection of servers.
Highly automating processes is prerequisite to collecting and getting the best from historian data, providing insight to improve diagnostic troubleshooting and identify improvement opportunities.
As more organizations gain access to sensor data, more job functions can leverage it. Many small and medium-sized manufacturers are still getting by with paper-based chart recorders, or perhaps with basic data loggers. Long term, though, there is an inexorable trend towards automating data collection, data historians, and cloud-based solutions. Faster reporting and diagnostics will drive productivity and profitability gains that will provide an unbeatable competitive edge.
Case study: Bottling plant decreases downtime
An example demonstrates the benefits of automating historian data analytics. A major bottling company manufactures and distributes more than 100 different flavors and brands and was named Bottler of the Year by Beverage Industry magazine in 2009. The company operates 27 bottling and distribution facilities in six U.S. states.
It runs a state-of-the-art manufacturing and sales distribution plant in Nampa, Idaho, as well as three other distribution centers throughout the state. For this facility, the company had set itself three goals:
- Improve changeover performance by accurately identifying constraints and bottlenecks
- Facilitate better decision making for cross-functional teams through consistent and reliable data, which would eliminate guesswork and assumptions
- Understand payback metrics and use data to justify future projects requiring control investment.
The Nampa facility was built in 2005 and was equipped with a combination of new and legacy machinery. Blending these assets proved possible, but issues of waste and downtime were apparent. Additionally, a homegrown data collection system that had been in place for the legacy assets did not take full advantage of the capabilities of the new equipment.
Operators tracked downtime and recorded it manually during their shifts. Relying on these clipboard notes sometimes led to inconsistent decision making and an inability to track trends accurately over time. The company knew that better solutions were available, and its vision included a performance management and downtime tracking system that would connect all of the equipment, and that would also help them quantify the return on investment and justify future plant upgrades.
With such a wide variety of products, making smooth switches between formulations is central to the plant’s productivity. Before the historian data solution was installed, engineers estimated that changeovers took 60 minutes. With the new system in place, the data showed the actual time to switch between flavors averaged 90 minutes.
Realizing that this degree of downtime was putting a damper on profitability, the company deployed the historian data solution to identify the chief constraints and their root causes. Armed with this data, they determined that the most critical bottleneck was in the filler process. Correcting this issue improved changeovers by up to 45 minutes and resulted in additional savings in raw materials and packaging. Efficiency on the filler line increased by 10%.
The historian data solution provides reports and trending tools that enable cross-functional teams to analyze plant operations consistently. Maintenance, operations, and engineering staff members can depend on accurate, reliable data, which takes guesswork and assumptions out of the process. The company’s personnel are also able to share an overall view of operations and have access to a graphical visualization of the plant makes operational tasks intuitive and facilitates clear communications. It also makes the system easy for new operators to learn. Results of this implementation include:
- Reports and trending capabilities of the software-enabled cross-functional teams to review performance data in consistent, reliable, and easily shared formats.
- Cause of downtime in the changeover process identified, leading to a 50% reduction in changeover time and additional savings in raw materials and packaging.
- Plant has achieved an overall 10% increase in line efficiency.