


If there’s an analytics lesson to be learned from the 2016 election, it’s that pure number crunching isn’t a successful predictor of human behavior. Rather, political science models that studied patterns and trends did a much better job, and in one case, so did an artificial intelligence system.
Fivethirtyeight.com modeling had put Clinton’s chances of winning the electoral college at around 70 percent before votes were counted. The site, however, had posted on Nov. 4 that Trump was within a polling margin of error for a victory, which should have been seen as flag that the election was a virtual tossup.
VoteCastr, a startup company, used early voting, microtargeting models based on demographic and voter data, and observed field data at select precincts in battleground states to predict turnout. Their final prediction for the night, before real-time results came in, had Clinton ahead in Florida, Pennsylvania, Wisconsin, Ohio, New Hampshire, Iowa, and Nevada. Out of all those states, Clinton won only Nevada and New Hampshire.
Meanwhile, the RealClearPolitics electoral map, which is based on poll averages, had given Clinton an edge in crucial battleground states she later lost, such as Michigan and Pennsylvania.
So what happened? Some political analysts speculate that a late-released letter from FBI Director James Comey, regarding investigation of Clinton’s use of a private email server, may have tilted the election towards Trump in a way that polls didn’t reflect.
Fivethirtyeight had modeled a 3-point shift away from Clinton initially after release of Comey’s letter, but Clinton apparently recovered ground in final polls leading up to the election.
It’s also been speculated that the phenomenon of herding, in which some polls take cues fro other polls, may have improperly skewed results towards one direction.
Another factor was underestimation of Trump’s turnout among white voters.
One of the 2016 presidential election polls, however – the 2016 USC / LA Times poll – had pegged more overall support for Trump than Clinton. The poll surveyed 2,000 national voters every week, with 500 tracked daily, and used different weightings compared to other polls. While Clinton will likely win the popular vote while losing the electoral college, the poll had noted that “Trump’s chance of winning depended on mobilizing white voters who had sat out the 2012 election — something that he clearly has succeeded in doing in several key states.” The poll also modeled a stark shift away from Clinton in the final days leading up to the election.
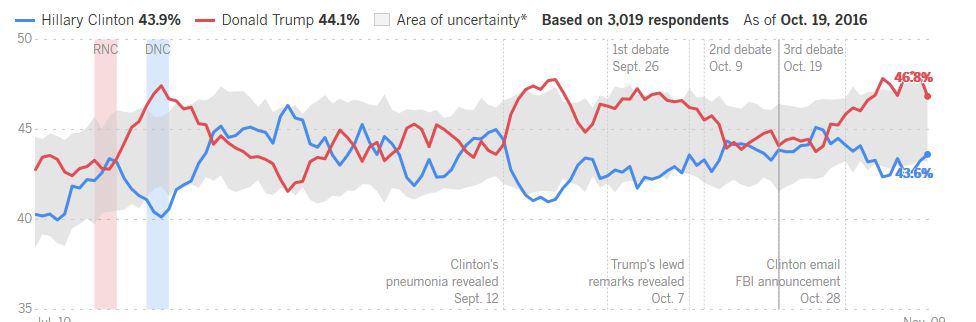
Source: LA Times.
AI system saw outcome
On Oct. 28, MogIA predicted a Trump victory after analyzing over 20 million data points, including social engagement on Facebook, Twitter, YouTube and Google. The system was developed by Genic AI, an Indian startup, and has been used to successfully predict past elections.
Political science models
One behavioral model based on voting patterns and preferences successfully predicted the result. Professor Alan Lichtman of American University in Washington, D.C. developed a model called “Keys to the White House” that doesn’t use polling data but rather a series of 13 true-false statements.
Those include party mandate, no serious contest for incumbent party nomination, economy, foreign policy success or failure, and candidate charisma. Lichtman, who has successfully used his model to predict 30 years of elections, predicted that if six or more of the keys went against the incumbent party—and they did—the challenger would win the White House. And that’s what happened. Lichtman derived the “Keys” system by looking at every American presidential election from 1860 to 1980.
As Vox pointed out, other political science models also were relatively on target. Those included a model by Yale’s Ray Fair, which uses macroeconomic indcators, and predicted a Republican would win with 58 percent of the vote. (Fair’s model was off, however, in 2012).
A model from Stony Brook’s Helmut Norpoth and University of Wisconsin Milwaukee’s Michael Bednarczuk, meanwhile, predicted a Republican would win with 52.5 percent of the vote. The Stony Brook model uses a candidate’s performance in primaries and accounts for a party holding office two consecutive terms. The model has been correct for each of the past five presidential elections, except for 2000, and has been used to retroactively predict every election since 1912, except for 1960.