

Update: Trump has won the election. See “Why Big Data Failed to Predict the Election, But Some Models Worked.”
As America welcomes the end of a brutal election cycle and heads to the polls, Slate and VoteCastr have announced a partnership that will bring real-time 2016 presidential election predictions from seven battleground states, each of which have a crucial role in electing the next president.
Normally the nation looks to exit polls for clues as to whether a candidate might win a state, and for a network to declare a “winner.” But starting when polls open on the East Coast, VoteCastr’s data collection teams will stream election projections in the battleground states of Florida, Iowa, New Hampshire, Nevada, Ohio, Pennsylvania, and Wisconsin.
The method entails hundreds of field workers monitoring turnout in selected precincts in those states and extrapolating selected precinct turnout data to the state. The turnout is then compared to large surveys of voting behavior that VoteCastr conducted prior to election day.
Dealing with uncertainty in predictive analytics
“These projections are being made in real time. They can’t tell us who will win a particular state, only who is winning the state at that moment and who might win if current trends continue,” wrote Slate’s Josh Voorhees.
“We’re hoping to fill in the 24-hour void between the last pre-election poll analysis and the counting of the votes with data that can begin to answer the heretofore unanswerable question: Who’s actually voting?” Sasha Issenberg, Votecastr’s chief strategist, said in an interview with Politico.
While some in the media worry that providing such data could affect the outcome of the election — for example, people seeing their candidate has a strong lead so they don’t bother to go vote themselves — VoteCastr rejects their worries.
“It’s not as though voters go to the polls without indications about the state of the horse race,” Issenberg told Politico. “They’ve seen no shortage of polls, poll averages, poll aggregations, simulations and predictions before Election Day, and now see plenty of early-vote numbers being analyzed to determine who’s winning and losing. Why should information on Election Day itself be held to a different standard than on the day before it? “
Slate’s editor-in-chief, Julia Turner said that the site will issue clear warnings and caveats that the data they are publishing are not definitive totals.
Related: Using R for advanced predictive analytics (special report)
Why real-time political predictions can fail
VoteCastr’s methodology is based on microtargeting models. Before the election, landline calls (mostly automated, though some on cell phones to reach younger voters) ask how likely someone will vote for a certain candidate. These surveys are combined with demographics and commercial marketing data to predict information about every other voter. The models also take into account past voter turnout.
Turnout observations throughout the day at selected precincts that represent key Clinton and Trump areas allow for end-of-day turnout predictions at other precincts where direct observations were not available. That lets VoteCastr calculate each the state’s extrapolated vote for each of the four candidates (Clinton, Johnson, Stein and Trump.
But as a recent New York Times article relates, in 2012, President Obama’s re-election campaign leveraged real-time analytics to estimate results. By mid-morning, their model was reporting that young and minority voters weren’t showing up in Ohio, a crucial battlefield state.
But the model didn’t account for the variables in turnout, such as 9-5 workers waiting until evening to vote, younger voters voting later in the day, and wildcards like Democrat turnout waxing in the afternoon and Republican turnout waxing in the morning.
VoteCastr doesn’t account for these anomalies. If 30 percent of the day has passed, it assumes 30 percent of voters have turned out. Or, if it believes 500 voters in a particular precinct have voted, it will assume they are the likeliest 500 voters. It doesn’t account for unlikely voters, of which many will show up and who tend to lean Democratic, the Times noted.
The same problems facing polls — will undecided voters or minor candidate supporters break one way? — also apply to VoteCastr’s model. The projections will shift throughout the day and it could be difficult to discern the one question that will be on everyone’s minds: Is turnout deviating from expectations?
Obama’s campaign leveraged some of the top talent in analytics at the time and still they wound up with uncertainty about the turnout in a key state. VoteCastr’s data could generate similar uncertainty and angst among election watchers — because this election cycle hasn’t been stressful enough already, right?
Update: 12:44 a.m. PST, Nov. 9 — The early VoteCastr trends did not hold, as Clinton conceded the election to Trump, who won by an electoral vote margin of 276 to 218, winning key battleground states that VoteCastr had earlier predicted would sway Clinton . Even advanced poll-crunching analyses, such as run by fiverthirtyeight.com, which gave Clinton a 70 percent chance of winning before the election, were off.
— Update: 4 p.m. PST:
Polls have begun to close on the East Coast. VoteCastr is predicting that Clinton holds a lead in all seven battleground states. But while her lead is looking comfortable in Florida, it is tight in other battlegrounds — a trend that VoteCastr pegged early in the day. What will be interesting to watch is how these turnout numbers as predicted by VoteCastr dovetail with actual election results:
Florida: Clinton leads by 4.72 million to 4.41 million votes for Trump. Both Clinton and Trump have surpassed 2012 turnout.
Pennsylvania: Clinton 2.31 million; Trump 2.17 million.
Ohio: Clinton 2.35 million; Trump 2.33 million.
Wisconsin: Clinton 1.24 million; Trump 1.07 million.
Iowa: Clinton 614,000, Trump 599,000.
New Hampshire: Clinton: 279,000; Trump: 258,000.
Nevada: 473,000 Clinton; 465,000 Trump. Trump has surpassed 2012 turnout for Romney.
Update 12:51 p.m. PST: Voting has been in full swing at East Coast polling locations for a large portion of the day. VoteCastr’s model is predicting Clinton with turnout edges in all battleground states, though margins in some states are very tight:
Florida: 4.22 million for Clinton, 3.94 million for Trump. That would put Clinton over Obama’s 2012 turnout based on VoteCastr’s “so-far estimates,” which include early voting as well as observed field data. That may be likely due to a surge in Latino voting for Clinton. However, a similar surge has also been predicted in Nevada, but so far the vote in Nevada is much tighter than that of Florida:
Nevada: 408,000 for Clinton, 401,000 for Trump.
Elsewhere, the “so-far” estimates are:
Pennsylvania: 1.78 million for Clinton, 1.68 million for Trump.
Ohio: 1.96 million for Clinton, 1.93 million for Trump.
Wisconsin: 995,000 for Clinton, 856,000 for Trump.
Iowa: 524,000 for Clinton, 505,000 for Trump.
— Update: As of 10 a.m. PST, Clinton had a lead of about 2.5 percent over Trump in Florida based on turnout, according to VoteCastr’s tracker. Clinton had a slight turnout edge in Iowa and Ohio as well, based on early turnout, and was running neck-and-neck with Trump in Nevada. We’ll be checking the predictions compared to actual results to see how VoteCastr’s model did —
Related: Predictive marketing in ecommerce
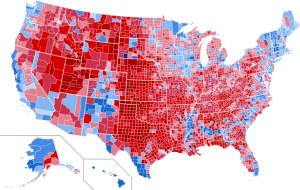
Photo credit: By Inqvisitor (own work) [CC BY-SA 3.0 (http://creativecommons.org/licenses/by-sa/3.0)], via Wikimedia Commons