


In the current digital landscape, enterprises grapple with vast amounts of expanding data from their applications. These applications and their supporting infrastructure generate telemetry data (logs, events, metrics, and distributed traces) that organizations can analyze to manage this data complexity.
Metrics, in particular, are the lifeblood of observability, offering crucial insights into the performance and health of systems and applications. They are invaluable to site reliability engineers (SREs), DevOps engineers, system administrators, data analysts, product managers, CTOs, and business leaders who depend on metric-derived insights to inform strategic planning.
Understanding the structure, identifying the best format, and applying appropriate normalization techniques will give metrics the power to inform problem resolution and decision-making.
See also: Full-Stack Observability Improves Uptime, Lessens Outage Cost
Anatomy of a Metric
Conceptually, metrics represent a system’s vital signs. Systematically captured and monitored, they offer visibility into system performance, application behavior, and user engagement.
To extract insights, one must grasp the fundamental components of a metric:
- Name serves as its identifier.
- Value represents the core quantitative measure.
- Timestamp enables the tracking of changes over time.
- Tags/Labels provide additional context and specificity through key-value pairs.
- Type categorizes the metric.
- Unit ensures standardized measurement for uniform interpretation.
- Description (metadata) offers brief contextual insights.
- Aggregation is how the metric has been summarized, such as by averaging.
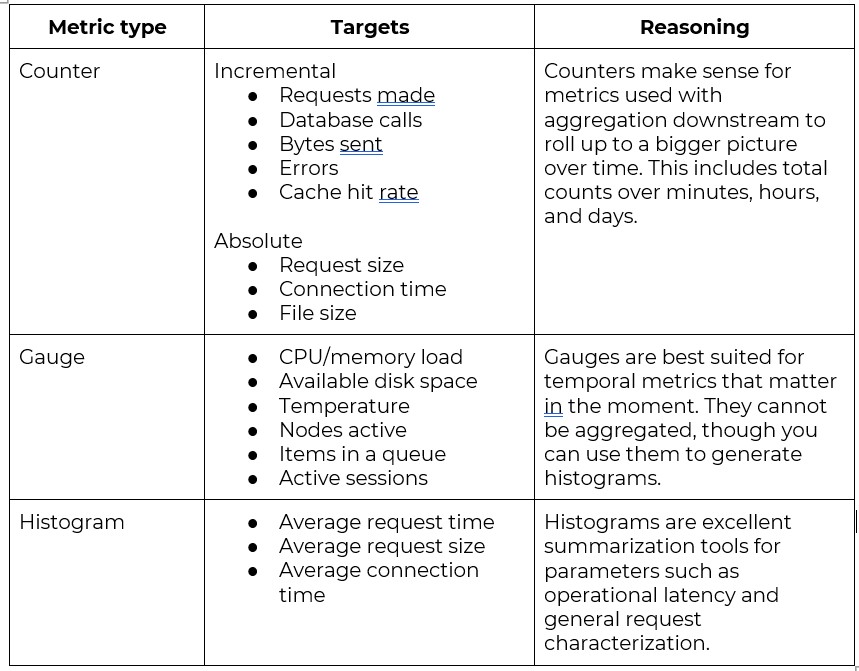
It’s also important to understand the various metric types, such as Counters, which tally events or actions; Gauges, which provide a snapshot of a value at a specific moment, revealing instantaneous system states; and Histograms, which unveil the distribution of numerical data, such as page load times.
Histograms can be a diverse set of formats, like Ratio, which expresses the quantitative relationship between two values; Percentage, portraying a value as a fraction of 100; and diverse summarization methods like Average, Median, Mode, and Range, each of which offers a varied perspective on data interpretation.
A thorough understanding of metric components, types, and formats helps professionals optimize the efficiency and efficacy of their monitoring. Why would you want to optimize? The cost to store and search metrics adds up quickly. Choosing the right metric can minimize cost while maximizing visibility.
We’ve summarized some of what we believe to be the optimum usage of each metric type below (note this is not exhaustive):
Navigating Data Models: OTel, Prometheus, and StatsD
In moving to practice, a data model defines how metrics are represented, related, and stored. There are three popular data models — OpenTelemetry (OTel), Prometheus, and StatsD — and choosing one impacts how efficiently data can be analyzed and utilized.
OTel supports various metric types and facilitates rich contextualization by correlating metrics, traces, and logs. This model excels in environments where connecting metric data with specific traces or logs is crucial. Prometheus stores data as timestamped values alongside key-value pair labels. This model is great at capturing the system’s state at different points in time for trend analysis. StatsD supports basic metric types and sends metrics over user datagram protocol (UDP) packets for minimal overhead. It’s ideal for high-speed and high-volume data collection scenarios.
Understanding nuances such as the distinction between OTel sums and time series counters in Prometheus is key if you use a combination of data models. OTel sums capture the total sum of a particular measurement over a period, while time series counters continuously track increments over time. Other factors to consider among these data models include protocol and transport, push vs. pull metrics, metric types, contextual information, integration and instrumentation ease, and storage and visualization. OTel has its own protocol, OTLP, a newer standard now gaining more support. Prometheus supports remote write, which is an RPC protocol.
It’s not merely about housing metrics but also standardizing and influencing how telemetry data is organized and analyzed. Each model carries unique capabilities, affecting the data’s structure and the insights it can provide.
See also: 8 Observability Best Practices Every Org Should Implement
Telemetry Pipelines Unlock the Potential of Data
Metrics are only useful for monitoring if you can always keep them flowing. With the number of endpoints and the amount of data in modern environments, managing the metrics stream is not an insignificant task.
A telemetry pipeline helps efficiently manage the flow of telemetry data, including metrics, within an organization. At its core, a telemetry pipeline orchestrates the collecting, refining, and routing of data from applications, servers, databases, devices, or sensors. This structured process ensures that the data is transformed into a usable format and directed toward analytics or observability platforms for activities ranging from troubleshooting to security operations.
The pipeline operates through three fundamental stages: data collection, processing, and routing. In the data collection phase, agents extract data from various sources, while the processing stage involves validation, cleansing, and aggregation to refine the information for analysis. In the routing phase, processed data is directed to its intended destination, such as cloud storage for long-term archival or analytics platforms for real-time insights.
Organizations grappling with overwhelming data volume, varied data formats, accessibility challenges, or a need for real-time data processing can benefit from implementing telemetry pipelines. They offer efficiency, scalability, data integration, and cost optimization to help organizations keep the metrics flowing and unlock the full potential of their operational intelligence.
Telemetry Pipelines Help Normalize Metrics
What can telemetry pipelines do that normal collection methods cannot? For example, if you’re running a combination of OTel and StatsD, the different data types are not entirely compatible. Or your downstream tools may not accept metrics in their source format.
Telemetry pipelines can help normalize different metric data types. They convert metrics from their source format and automatically transition them to an external format using a specific metric data model.
With metric normalization, unified analysis becomes possible, allowing professionals to run analyses without constantly adjusting to different metric structures, ensuring quicker and more efficient evaluations. It also enhances integration with various tools and platforms, reducing compatibility issues and optimizing storage resources. Alert thresholds and triggers can be set up with greater accuracy, preventing false positives and flagging issues in real time. And metrics can be aggregated to help derive insights from large datasets without incurring excessive costs.
Metrics Provide an Observability Advantage
Mastering metrics is not merely a technical requirement but a strategic advantage for observability. For companies with significant digital infrastructure, this can be easier said than done. Telemetry data is increasing in volume and complexity, making it critical to seek tools and tactics to normalize metrics for maximum benefit. Those who succeed will glean invaluable insights through understanding, comparison, and efficient management, positioning themselves for informed decision-making, optimized operations, and sustainable growth.