


The challenge of visibility continues to plague IT and business leaders alike, but there seems to be some confusion about what “visibility” actually means and how to enable it.
The challenge is typically interpreted as a lack of data about applications and infrastructure. The truth is, we have plenty of data. In fact, we have an overabundance. Data about the health and performance of applications, systems, and services is constantly charted and displayed on a variety of dashboards and tools.
See also: For True Digital Transformation Organizations Must Think Bigger
Every modern dashboard provides visualization of key data points. But these data points often represent binary metrics about a system that tell us very little. For instance, such a visualization might alert us to the fact that two nodes in a cluster were “down.”
Well, so what? Hardware fails. Applications crash. Networks become congested.
What we really need to know is: Was the customer experience impacted? And if so, how?
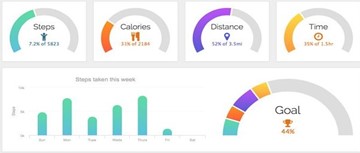
This is akin to consumer health applications. Those dashboards visualize plenty of user activity. Is the data helpful for tracking progress against exercise goals? Yes. But is it meaningful information about the person’s health? Not really.
Similarly, industry apps collect a lot of useful data, but none offer the insights required to take impactful action or meaningfully answer a digital enterprise’s most pressing questions about customer experiences.
The challenge of visibility is not data. Rather the challenge is we don’t have tools capable of analyzing the data and generating actionable insights. So how do we get there, and what’s in the way?
The siloes and subjectivity slowdown
Raw data signals are rarely correlated in a meaningful way by the tools and dashboards providing them. Each data set is gathered by its own system and visualized via its own dashboard. The data is presented through a raw view that does not lend itself to quick analysis or speedy issue resolution.
Think of the consumer health app. If my heart rate suddenly spikes, an alarm may sound, but I’m the only one alerted. And even if the alert is shared with someone who can take action, the data they receive lacks context—was I exercising at the time? Not knowing that makes it difficult to interpret what to do about the alert.
The same is true with application performance monitoring (APM) systems. They don’t report meaningful insights like “your customer experience is poor because your SSL termination is slow.” They just display data. By the time we leverage tools that can ingest it, and human beings are able to analyze it, the problem has either resolved or the customer has abandoned the application and likely the brand as well.
Relying on human intervention comes with other problems. Continual data bias exacerbates the challenge. Bias is caused by opinionated curation of data within the system. Where data collection agents are deployed introduces bias. The visualizations we choose to display on dashboards introduces bias. The experience of the operator, administrator, developer, and C-suite executive interpreting the data introduces bias. Is the spike in web server memory utilization caused by the garbage collection process or an HTTP flood attack? The interpretation depends largely on a person’s experience and role.
Modernization is also complicating things. Distributing components of a digital experience to the public cloud and the network edge exacerbates the challenge. App modernization exacerbates the challenge. A roaming, mobile workforce exacerbates the challenge.
All these issues with the generation, collection, and interpretation of data make answering real questions about your customer experience nearly impossible. The old paradigm of sending telemetry in the form of logs and time-sliced performance data to systems that run pre-defined queries does not address the need for near-real-time reporting on business outcomes and customer experiences.
What organizations need is more than data and visualization through multiple dashboards. They need a new level of analytics that brings together all of their network and app data in a way that truly aligns with their business.
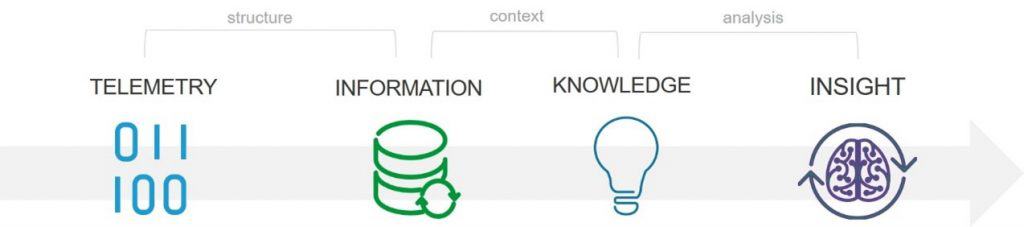
From telemetry to insight
What’s needed is advanced, machine-led analytics that spans the entire customer experience. Organizations must move beyond visualizing singular, siloed data streams toward end-to-end analytics that offer insights into existing conditions—ultimately moving to predictive analysis that incorporates multiple dimensions likely to impact performance or customer experience.
This capability comes from understanding how infrastructure and applications map to digital workflows and efficiently correlating disparate data points across them to discover the source of a slowdown or failure.
Making data streams meaningful requires us to make better use of all the data we have available in a seamless way, including telemetry across the entire customer experience—every request and every response, performance and status at every layer, from latency and loss in the network to application usage patterns across time.
From there, an organization can create the ability to recognize the application and business patterns that make up its unique digital experience. Building this means combining the telemetry available from application services with analytics and machine learning that can separate the signal from the noise and recognize “normal” performance and behavior. Now instead of pointing at a failed node somewhere, we are pointing at the actual component, device, API, or service impacting the customer experience.
No two workflows are going to be exactly the same. No two businesses measure success in the same way. Traditional monitoring solutions have assumed they do. Based on that assumption, they fail to provide access to the data in a way that would enable customers to define their own metrics based on their own business logic.
The best approach is to democratize data so every organization can extract insights based on their own expertise. The ability to recognize those unique patterns enables the system to detect deviations that indicate problems with performance or availability.
Using machine-led analytics, we can correlate signals across a customer experience and finally answer the most pressing questions business has: “How is my customer experience today?”