


The ability to monitor suspicious activity and price limits in real time is crucial for financial service industries. Here’s how Cleartrade Exchange used data visualization tools to solve the problem.
Name of Organization: Cleartrade Exchange
Industry: Financial Services
Location: Singapore

Business Opportunity or Challenge:
In the commodities world, values and prices can change dramatically from minute to minute. But technology has only begun to catch up with the requirements for staying ahead of this challenge.
Such was the challenge for Cleartrade Exchange (CLTX), a regulated futures market for the global commodity derivatives marketplace, launched in 2010 and based in Singapore and London. CLTX needed to enhance its internal market surveillance, including the real-time monitoring of six asset classes with approximately 200 contract periods. The existing process relied on Microsoft Excel, which was unreliable and could not be refreshed more than once a day.
The data involved comparing real-time quotes and orders against pre-defined price limits set by the exchange to see if there were any breaches in the price limits for the day. The asset classes were all commodity derivatives and included freight, ferrous, energy, and agriculture derivatives across individual forward curves. The exchange sought to speed up access to this data to prompt staff of the need to cool off certain markets when they became too volatile, and it was previously not possible to do so.
CLTX offers an electronic order book with a suite of over 40 different derivative contracts. The exchange was established in response to G20 global regulatory reforms throughout the commodity derivative marketplace. CLTX was acquired in December 2013 by the European Energy Exchange (EEX), which propelled CLTX to enhance its services in a new global marketplace. But CLTX’s existing tools for monitoring trading limits imposed by regulators were not keeping pace with the business and regulatory demands.
How This Business Opportunity or Challenge Was Met:
Because of a growing number of products and increasing liquidity on the exchange, CLTX sought data visualization tools that could meet an extensive list of needs, including ease of use, extensibility and flexibility to meet changing requirements without massive development effort. The exchange also wanted data visualization tools that would integrate a variety of data including streaming sources. Most importantly, the exchange needed to be able to quickly visualize and analyze market trades and detect suspicious or out-of-limit activity.
To address these requirements, CLTX implemented the Datawatch solution, which enables real-time access to data feeds — such as those from Thomson Reuters — and the ability to visually detect and take action on suspicious events. The CLTX team made use of real-time price feeds extracted from the Thomson Reuters Eikon system to feed into the Datawatch visualization tool.
Measurable/Quantifiable and “Soft” Benefits:
After implementing the software, the CLTX team is now able to monitor real-time price limit breaches on the exchange. They have been able to replace their Excel-based processes with real-time data displays.
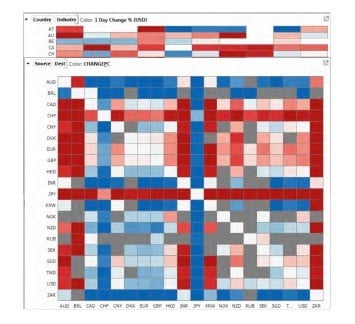
A Datawatch heat matrix.
Analysts can now create a snapshot of the market at any point in time through a heat matrix, or any variety of intuitive visualizations.
CLTX now also has real-time monitoring and alerting capabilities, which provides actionable surveillance across the entire set of commodities and all CLTX exchange participants. In addition, high-density visuals and data discovery features enable analysis of both real-time and historical data, the combination of which can reveal new insights.
The new data visualization tools let CLTX staff pinpoint outliers in real-time, perform deep analysis on historical data, and present their discoveries and findings to colleagues and management. The main benefits have been enhancing the exchange’s market surveillance procedures, and providing market participants with a more robust, fair and orderly market.
A key lesson learned from the project was that the Datawatch tool is capable of many different visualizations that could be useful throughout the organization. CLTX’s research and management reporting teams will be looking to let other teams make use of the tool in the coming year.
(Sources: Cleartrade Exchange, Datawatch)
Want more? Check out our most-read content:
What’s Behind the Attraction to Apache Spark
The Value of Bringing Analytics to the Edge
Preventing Downtime With Predictive Analytics
IoT Hacking: Three Ways Data and Devices Are Vulnerable
Liked this article? Share it with your colleagues!


