Best Practices for Deploying and Scaling Industrial AI
Artificial Intelligence (AI) is transforming industrial operations, helping organizations optimize workflows, reduce downtime, and enhance productivity. Different industry verticals leverage AI in unique ways.
Accelerating Manufacturing Digital Transformation with Industrial Connectivity and IoT
Digital transformation is empowering industrial organizations to deliver sustainable innovation, disruption-proof products and services, and continuous operational improvement.
Leading a transportation revolution in autonomous, electric, shared mobility and connectivity with the next generation of design and development tools.
As businesses become data-driven and rely more heavily on analytics to operate, getting high-quality, trusted data to the right data user at the right time is essential.
The goal of automated integration is to enable applications and systems that were built separately to easily share data and work together, resulting in new capabilities and efficiencies that cut costs, uncover insights, and much more.
Digital transformation requires continuous intelligence (CI). Today's digital businesses are leveraging this new category of software which includes real-time analytics and insights from a single, cloud-native platform across multiple use cases to speed decision-making, and drive world-class customer experiences.
IoT Analytics: How to Move from Data Integration to Real-Time Intelligence
Getting business insights from IoT projects requires companies to overcome challenges related to data integration, data quality, and actionable business intelligence.
The tech industry likes to toss out buzzwords such as “digital transformation” and the “Internet of Things,” but how do they benefit a business?
At its core, digital transformation with the IoT involves making better, faster business decisions. Traditionally businesses would use end-of-the-day reports and relied heavily on Excel spreadsheets to optimize operations. Organizations started moving to data warehouse models in the 1990s, but data analysis often took hours or days.
Today it is possible to connect business processes and systems to the internet, such as for enterprise resource planning and customer relationship management. And through the explosion of machine sensors and networks, it is now possible to connect point-of-sale systems, manufacturing equipment, or devices used in smart buildings.
When point-of-sale data is combined with manufacturing and warehouse data, a retailer can optimize their supply chain to increase sales and ensure a smooth customer experience.
A manufacturer could predict when a piece of equipment might fail, or spot defects on a production line, saving millions of dollars.
A smart building might continually adjust the temperature in certain rooms, solar output, or lighting, leading to substantial energy savings.
A transportation or shipping system could reroute during times of congestion, thus improving customer experience and gaining insights on future planning.
Achieving such benefits, however, does not come without challenges, such as:
Data silos. Systems in an IT architecture might be unable to share data. Or they might transmit data that an analytics system can’t parse. Integration is commonly cited as one of the costliest and most complicated aspects of IoT projects, and it can derail a project before it gets started.
Data could be missing or wrong. More than 68 percent of respondents to a recent survey said that data quality was their most common challenge, but only 34 percent had confidence in their ability to detect divergent data. The consequences of poor data quality can be enormous: Wrong or delayed decisions, budgetary waste, and mistrust between departments that need to cooperate on data analysis.
Powerless analytics. Organizations need to deliver the right data at the right time to decision-makers. In that respect, finding data can be as important as delivering it. Applying predictive scoring to data in motion, for instance, can help identify crucial data that gets selected for further analysis and delivery. Consider a manufacturer that needs to monitor how equipment performs to optimize production and prevent waste or downtime. A business manager does not need to see millisecond readings of temperature, vibration, or pressure on a piece of manufacturing equipment; he or she only needs an alert, based on predictive scoring, whether something might be wrong.
Advertisement
The road from data integration to actionable analytics requires companies to overcome all three of those challenges. Let’s take a look at how that can be done.
Dealing with integration
Wringing value from an IoT project often requires integrating devices, business systems, and databases. A company that wants to optimize sales and supply chain, for instance, will need to have point-of-sale data, warehouse data, and shipping data.
But integration has been cited as one of the top and most costly barriers to adopting IoT analytics. Gartner has estimated that through 2018, half the cost of implementing IoT solutions will be spent on integration. The average cost per project of integrating device, data and systems is about $8 million per project. McKinsey & Company, meanwhile, pegs 40 percent of the value of the IoT on interoperability.
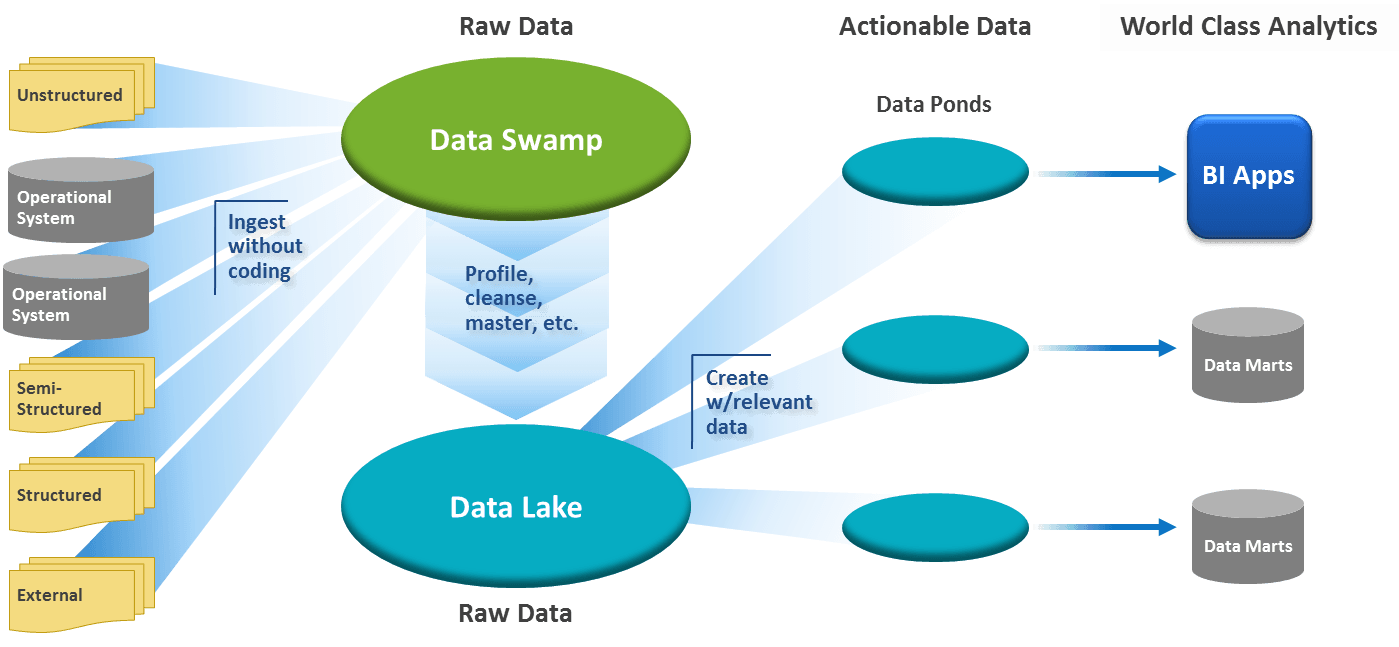
A schematic of data integration, starting with ingestion from a variety of sources, then moving to a data lake and analytics.
Companies generally have two choices when pursuing an IoT integration solution: Add IoT functionality to existing systems, or create/buy an end-to-end solution. Ripping out an entire IT architecture and replacing existing systems can be costly, which is why companies tend to look towards added functionality. Organizations want tools that can integrate data from existing systems – whether machine data, legacy systems, business applications, or big data systems such as Hadoop.
Data integration examples
Power outages cost utilities and their customers $52 billion a year, with most of the cost due to equipment failure and bad weather.
Today, IoT-enabled smart meters can send aggregated information about five-minute power use in a certain geographic area to utilities. Advanced Distribution Management Systems, which take data from IoT devices on the distribution grid, are software programs that can automatically dispatch a crew to a specific piece of equipment on an exact place on the grid.
Achieving such a vision requires integrating data between IoT devices and other systems, then analyzing it. For example, BC Hydro, which serves more than 1.7 million residential customers in British Columbia, was able to integrate 30 different operational and IT systems – including homegrown and legacy systems, as well as IoT-enabled distribution equipment and smart meters. Once integrated, IoT analytics allowed BC Hydro to restore power faster, thus saving money and enhancing the customer experience.
The monetary benefits of such integration can be enormous. Indian Oil, for instance, was able to see real-time data on consumption of liquid petroleum gas. The company collected data from 43,000 IoT-enabled customer touchpoints in oil and gas refining, distribution, and retailing, then integrated that data with customer accounts and applied analytics. The result: Indian Oil saved $475 million a year.
Another IoT integration success story comes from Cascades, which makes packaging and tissue products composed of recycled fibers. Cascades has more than 100 production units in North America and Europe, and uses GE Proficy Plant Applications to monitor machinery with sensors that gather IoT data about temperature, humidity, and other conditions.
Advertisement
But Cascades wanted to become a “just-in-time manufacturing” facility in which real-time analytics could be used for an enterprise-wide view of purchasing, production, planning, warehouse management, and plant maintenance. To achieve that vision, Cascades rolled out a new SAP R/3 enterprise resource planning system, but a challenge arose: SAP could not be integrated with legacy AS/400 systems that run payroll, execute plant-floor processes, purchase raw materials, coordinate logistics, order spare parts, and conduct specialized planning and forecasting.
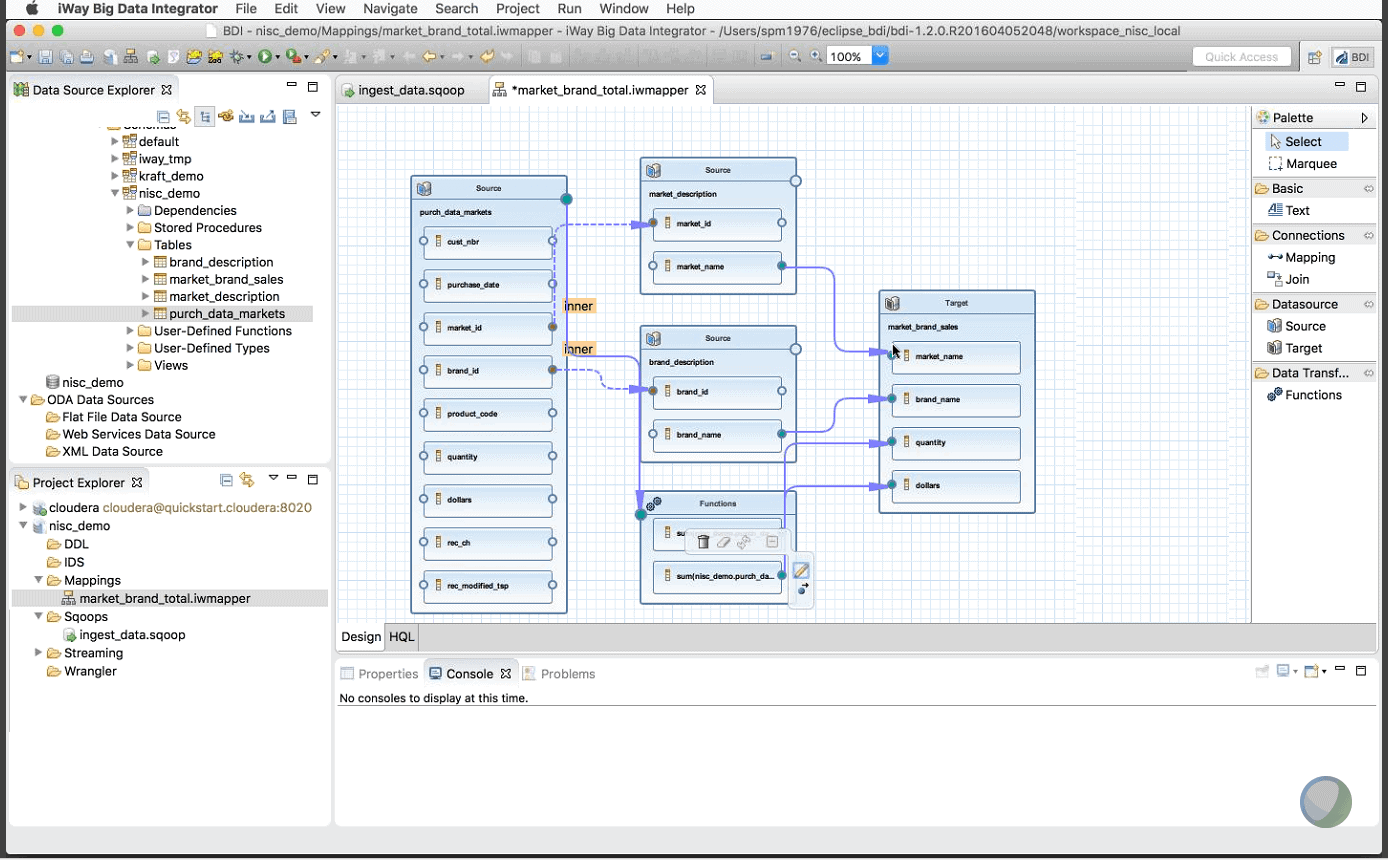
Cascades turned to iWay integration software from Information Builders as a plug-and-play interchange for technology assets and data stores. With the iWay integration between SAP and legacy systems, Cascades now keeps IoT-enabled production equipment running optimally, monitors the quality of finished goods on the production line, improves forecasting, and removes waste from the supply chain.
“Plant managers can take action right away, rather than the next day or the next month,” Eric Mayrand, a software development manager at Cascades, said in a recent case study.“They also have a more accurate, real-time view of costs” and “managers can track sales and production continuously.”
The iWay interface for big data integration.
Data Quality, Filtering, and Enrichment
For data to have any value at all, it must be correct. Yet according to Experian, upwards of 92 percent of organizations suspect their customer and prospect data to be inaccurate.
The consequences of inaccurate or missing data are enormous. In a survey of 333 companies, Gartner pegged the losses resulting from poor data quality at $14.2 million each year on average, saying that companies lose more money in operational efficiency due to data quality issues than they spend on data warehouse and CRM initiatives.
What does bad or missing data look like? It could be an inaccurate address on a shipping order, meaning a crucial part doesn’t arrive on time. Or a supplier might have more than one SKU that works as a part for a buyer, so the two SKU codes must be reconciled.
A customer relationship management system, meanwhile, might have more than one address for a customer, or a missing email or phone number.
Advertisement
While such errors might seem innocuous, they can affect sales, lower customer satisfaction, and result in bad decisions or delayed decisions. In the case of inaccurate bills, wrong data can provoke angry lawsuits.
Big data heightens the challenge. The amount of data generated by industrial equipment – second-by-second readings of temperature, vibration and pressure – can be on the scale of terabytes per day. A customer relationship management system, meanwhile, could contain tens of thousands or hundreds of thousands of records, constantly being updated.
According to SAP, the business benefits of data quality include a 15 to 20 percent increase in revenue as well as reduced operating costs. A data quality tool can capture real-time alerts on business-critical data discrepancies, and quickly address data issues before they impact performance.
Data types
Data from a relational database is usually structured, but machine data often arrives as a series of numbers and letters that make no sense to a business manager. Machines may also emit so much data that an analytics system can’t keep pace and rules may need to be applied so that only relevant data is sent forward.
Social media data may be semi-structured, unable to be understood by a marketing manager. Often these data sources also need to be enriched with vital information containing customer account IDs or SKU numbers.
“Actionable Intelligence” from IoT Analytics
Once data has been integrated, validated, filtered and enriched, the task becomes how to present the data in the right way to the right business professional.
Suppose an extended forecast is calling for seven days of snow. A sales or production manager wants to see which products sold the best during a similar period to guide stocking decisions. That type of tactical decision requires a platform in which the manager can access and easily visualize that data.
Advertisement
Or consider smart buildings, which might be equipped with a solar panel, smart lighting, smart thermostats and HVAC systems. A smart thermostat might automatically adjust building temperature when electricity prices are the highest to save on energy. But an energy supply manager or utility might want to access historical data to guide future energy purchases. For example, would an investment in an energy-storage device, such as lithium-ion battery that can store power when the sunlight goes down, drastically reduce the building’s energy costs over a five-year period given the building’s evening energy use, the expected production from the storage system, and the utility’s billing structure?
San Diego’s Grossmont Union High School District, which has $4 million in energy costs every year, made such a decision. It announced plans to install 7.4 megawatt hours of energy storage across 14 sites and nine district locations, saving more than $6.4 million over the life of the project.
Case Study: Ace Hardware and Real-Time Business Intelligence
Ace Hardware, the world’s largest hardware co-op, has more than 4,600 locations in 70 countries. The company used self-service analytics software to provide actionable intelligence to the right business user at the right time. The platform integrates point-of-sale data, which was stored in a Teradata data warehouse, with data from an SAP R/3 enterprise resource planning system. The project created the following benefits:
Marketing and customer loyalty. Marketing personnel can gauge the effects of specific promotions on the improvement of the Ace Rewards customer loyalty program. Marketing professionals also measure the reliability and performance of suppliers by analyzing how well each vendor’s products are selling – a crucial piece of data when running a national promotion so that products can be in stores when needed.
Sales and inventory control. Retail managers, meanwhile, run point-of-sale reports to identify and target their best customers with specific campaigns. They monitor the top-selling items in each territory and make sure those goods are in stock at each retail location to take advantage of sales opportunities.
Production forecasting. Vendors, meanwhile, track how individual products are selling in each region throughout the year. Vendors know when to discontinue products that don’t sell and when to emphasize those that do.
Tracking performance. Business users throughout the company can access a dashboard that tracks daily sales at the retail and wholesale levels so they can measure how various items are selling by region, division, and product category. A separate dashboard lets the supply chain and merchandising groups analyze sales by vendor. Dynamic key performance indicators on the dashboard reveal service levels, back-orders, open order status, shipping metrics, and other variables.
A World of Possibilities With IoT Analytics
Looking ahead, Ace plans to use the platform – WebFOCUS from Information Builders – to offer portable analytics to field staff to analyze how well certain products are selling. Dynamic displays will help these workers analyze this data all the way down to point-of-sale transactions.
As recounted in a case study, the company also plans to use WebFOCUS for other data analysis projects, such as obtaining product information from the SAP Sales and Distribution module. The vision: Use self-service analytics to identify quick-selling, high-margin products that retailers might want to carry.
Expanding on the Ace example, numerous data links could be created between a manufacturer, a distributor, and a retailer. Data from IoT-enabled production machinery can help a manufacturer predict equipment failure, which helps the company avoid downtime. Meanwhile, point-of-sale and warehouse data can be fed into an analytics system to continuously monitor how well certain items are selling. That can optimize manufacturing decisions as well as marketing and sales.
Advertisement
In the case of a utility, smart meter data helps with effective outage restoration, but there’s another use case: Analyzing that data helps prevent energy theft, which costs utilities more than $89 billion a year globally. And in the case of a problem on the distribution grid, sensors and IoT-enabled equipment can help utilities optimize power flows, ensuring that an outage never occurs in the first place.
The above examples all show that once a system is in place to integrate, validate and analyze IoT data, multiple use cases across all levels of an organization can surface.
Why the next frontier in artificial intelligence isn’t a bigger model; it’s an independent layer that watches the model and has the authority to intervene.
If the history of artificial intelligence is viewed as a progression of architectural advances, Adaptive Intelligence may represent the next logical extension.
Analysis and market insights on real-time analytics including Big Data, the IoT, and cognitive computing. Business use cases and technologies are discussed.
Advertiser Disclosure: Some of the products that appear on this site are from companies from which TechnologyAdvice receives compensation. This compensation may impact how and where products appear on this site including, for example, the order in which they appear. TechnologyAdvice does not include all companies or all types of products available in the marketplace.