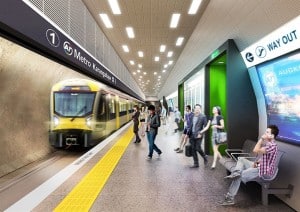
Where is everyone going and who are they?
Name of Organization: Auckland Transport
Industry: Transportation
Use cases: Traffic management, customer experience
Location: Auckland, New Zealand
Business Opportunity or Challenge:
Increasingly, transportation systems are turning to closed-circuit television and sensor technology for passenger safety, as well as to keep track of the locations and status of vehicles. However, all these cameras and sensors generate more data that many systems can handle.
Such was the transportation analytics challenge faced by Auckland Transport in Auckland, New Zealand, a quasi-government agency formed in 2011 from six regional councils. Auckland Transport is responsible for all of the region’s transport services (excluding state highways), from roads and footpaths, to cycling, parking and public transport.
“We look after everything to do with transport in the city. We run and operate the ferries, buses and trains, and we also promote and manage cycling across the city, walking activities, commercial vehicle planning, how they operate across the ports and carry their cargoes, and also carpooling schemes,” said Roger Jones, CTO for Auckland Transport.
Jones was recently interviewed by Dana Gardner in an edition of BriefingsDirect, discussing the increasing challenges of capturing and storing large volumes of real-time data. For example, the agency’s new trains emit a terabytes’ worth of sensor data – including closed-circuit television cameras – every month. The challenge is determining which data is of value. Along with this, Auckland has about 1,800 CCTV cameras on streets and interactions around the region to monitor traffic. If this is not enough, Auckland is also implementing data-driven parking systems.
Auckland Transport’s existing data warehouse system had about three terabytes of capacity, Jones said. From the CCTV cameras alone, “we take about eight petabytes of data a week, and that’s what we’re analyzing.” With the capacity it had at the time of implementation, Auckland could only support reactive investigations of camera-fed data for investigations, rather than active real-time management of roads and vehicles, he said. The challenge was to be able to “process it in real time, and be able to make it available again, both to ourselves, to the police, to the emergency services, and to other third-party application developers who can board their own applications using that data. It’s no value if it’s historic.”
How This Business Opportunity or Challenge Was Met:
Auckland Transport selected platforms and services from Hewlett Packard Enterprise to increase capacity to analyze data. The agency implemented a tiered approach.
The analytics on the CCTV is processed by the HPE IDOL engine, which allows search and analysis of text, image, audio and video.
“That strips most of it out,” Gartner said. “We integrate that into an incident management system, which is also running on the IDOL engine. Then, we take the statistics and the pieces that we want to keep and we’re storing that in HPE Vertica. The parking system will go into HPE Vertica because it’s near real-time processing of significant volumes.”
Auckland also employs its traditional data warehouse, built on Microsoft SQL Server, to manage corporate information, which combines statistical and financial data “so that we have all the historic information.”
Then, the integrated data is combined with additional information in Vertica and the Microsoft Analytics Platform System (APS) appliances to get us an integrated reporting at the front end in real time,” Jones pointed out. Information is then made available through an API manager, “so whatever we do internally is just a service that we can pick up and reuse or make available to whoever we want to make it available to. It’s not all public, but some of it is to our partners and our stakeholders.”
Measurable/Quantifiable and “Soft” Benefits:
As a result of its expanding real-time information capabilities, Auckland has seen payback from its integrated ticketing system, Jones reported.
“We run a tag-on,-tag-off electronic system. For the first time, we understand where people are traveling to and from, the times of day they’re traveling, and to a certain extent, the demographics of those travelers. We know if they’re a child, a pensioner, a student, or just a normal adult type user. We’re actually understanding, not only just where people get on, but where they get off and the time.”
As a result of this awareness, Auckland Transport is starting to better tailor its messaging to the public, Jones said. Along with train and bus tickets, Auckland Transport also has treasure troves of data from license-plate reading and parking data.
As a result, the agency now has a sense of how many trucks are moving through the main part of the city to access its port. “We have got a link route that goes into the port for the trucks. How many of the trucks use that versus how many trucks take the shortcut straight through the middle of the city?” The agency is employing its real-time analytics platform to understand this source of traffic congestion. The real-time traffic and performance data also enable ferry and bus operators to plan for their requirements.
Finally, the customer experience is greatly enhanced, Jones stated, as any incidents that may occur – such as an accident in a municipal parking lot – will be responded to quickly.
(Source: Dana Gardner’s BriefingsDirect)
Related: How real-time data keeps trains running
Want more? Check out our most-read content:
Intelligent Business Operations: White Paper
7 Essential Elements in a Real-Time Streaming Analytics Platform
Fog Computing: A Reference Architecture
Why Edge Computing Is Here to Stay: Five Use Cases
A Business Intelligence Strategy for Real-Time Analytics
Why IoT Edge Computing Is Crucial
Liked this article? Share it with your colleagues!


