

The graphics processing unit (GPU) has been around for decades, and while the specialized chips made their start in arcade systems and the now-ancient Atari 2600, contemporary iterations behave nothing like their predecessors. PCs and game consoles still use them to produce high-resolution, high-complexity graphics in real time, but starting in 2007, according to Nvidia, the architecture that makes GPUs possible was put to a second purpose: processing enormous amounts of data in parallel.
In a recent webinar, Sam Madden, professor at MIT’s Computer Science and AI Lab, said that GPUs are at the center of “a new frontier of interactive analytics” and will rely on “a new class of processing tools.” The tools use new technologies to query datasets, take advantage of GPU innovations, and put a heavy emphasis on data visualization.
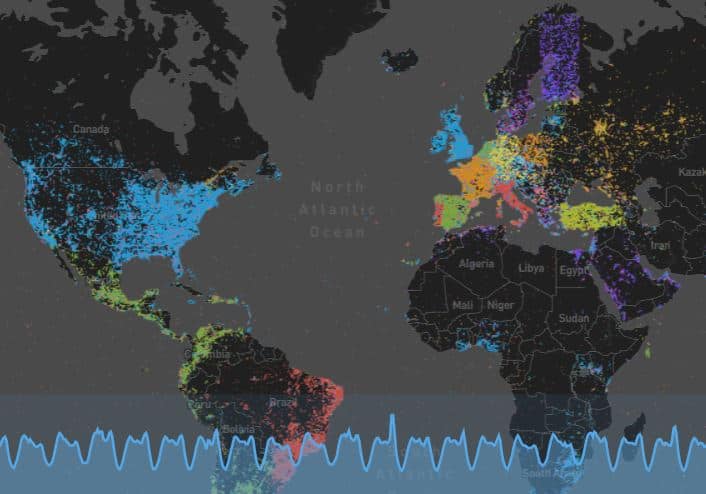
A map of real-time tweets by MapD.
Getting out of the big data bog
Madden says most businesses find three key challenges in dealing with their data: volume, velocity, and variety (plus value and veracity, if you ask others, see: Expert: Big Data Requires Scaling and Accessibility). Either they have too much data to process, the data is arriving too quickly or rapidly changing, or the analysis of the data required isn’t a standard spreadsheet.
Volume isn’t a big problem, Madden says—it’s relatively easy, although expensive, to pay a company to store a petabyte of data. Accessing and parsing that data remains a challenge, however.
“There is a huge performance gulf between what existing data processing systems can do — whether they’re cloud-based systems, next-generation NoSQL systems, or Hadoop– and Spark-like systems, and what people really want to do, even on simple tasks,” Madden says.
To put the problem in context, it can take older SQL-based systems, which were designed when computers had mere megabytes of RAM, nearly 30 seconds to process 10 GB of data. MapD, one of the newer players in the real-time data visualization space, says their GPU computing system can achieve the same result in 75 milliseconds, thanks to a number of new innovations.
Getting faster
Todd Mostak, CEO of MapD, says that in a commonplace system today, “hot data,” or data that will need to be parsed most often or most extensively, is stored in the fastest RAM (L1), while “warm data” and “cold data” is stored in subsequently slower storage (L2 and L3). L1 storage can hold 24 – 384GB of data, but can process it at 3,000 to 5,000 GB/second. L2 handles 32GB to 3TB of data, albeit at a much slower 70-120 GB/second rate. Meanwhile, L3, on an SSD or NVRAM, can store up to 20TB of data, but can only process it at 1-2 GB/second.
A key approach of MapD’s system is to keep the hot data in GPU memory as much as possible versus other GPU systems storing the data in the CPU memory, only moving it to GPU at query time. A single-node configuration of MapD will support 192 GB of GPU RAM, but the system can handle up to 16 GPUs per server, allowing for analysis for analysis of multi-billion-row datasets by multiple simultaneous users.
Another key is to parallelize query execution. Data is split into small batches and uses many cores, at the same time, to prevent bottlenecking.
The company can also create machine code for custom queries using LLVM technology, which dramatically increases speed, and the database also supports SQL.
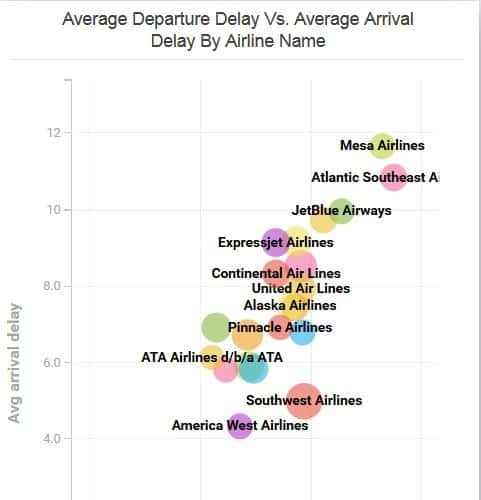
Flight delays by airline. Credit: MapD
Use cases
Vast quantities of data processing and query speed can be used to gather some incredible insights—for example, backend rendering means that web frontends don’t need to render huge volumes of data. Instead, MapD delivers a compressed PNG over the internet, at roughly 100KB, rather than gigabytes of raw data.
For graphical information systems (GIS), MapD-like data processing is unlocking entirely new potentials, according to Mostak. During the webinar, he demoed how MapD can be used to visualize every single New York City taxi ride in real-time—with little pause, he was able to zoom into different boroughs, or examine what time people were most dropped off at a Starbucks (weekday mornings) or at a Chase ATM (Friday and Saturday nights). For hedge funds, this data might reveal new opportunities—Mostak showed how an uptick in taxi drop-offs at NYC Hyatts occurred at the same time as an increase in the company’s stock price. He’s not willing to claim a correlation, but a hedge fund manager might just be willing to jump at these new data-led insights.
According to MapD, other use cases for the platform include:
- Finding patterns in social advertising across different demographic regions
- Troubleshooting telecom issues in real time by analyzing streaming call records and server logs.
- Inventory control and supply chain: A Fortune 500 apparel company is using the platform to query several billion rows of data in milliseconds, using visualization capabilities to discover store-level fashion preferences and to optimize their shipments.